
Trading analytics
Trading analytics that show what is driving your results
Traders Casa trading analytics turns your recorded trades into filterable performance analysis, so you can see what is making or costing you money. Instead of stopping at overall P&L, you can examine more than 300 analytics, narrow the data to a specific condition and use the same analysis across backtested and live trades.
- Filterable analytics across your recorded trades
- 300+Filterable analytics across your recorded trades
- The same analysis on backtests and live trades
- Both sidesThe same analysis on backtests and live trades
- Filters you can reapply as the record grows
- SavedFilters you can reapply as the record grows
- Insight on the results without reading every metric
- Casa AIInsight on the results without reading every metric
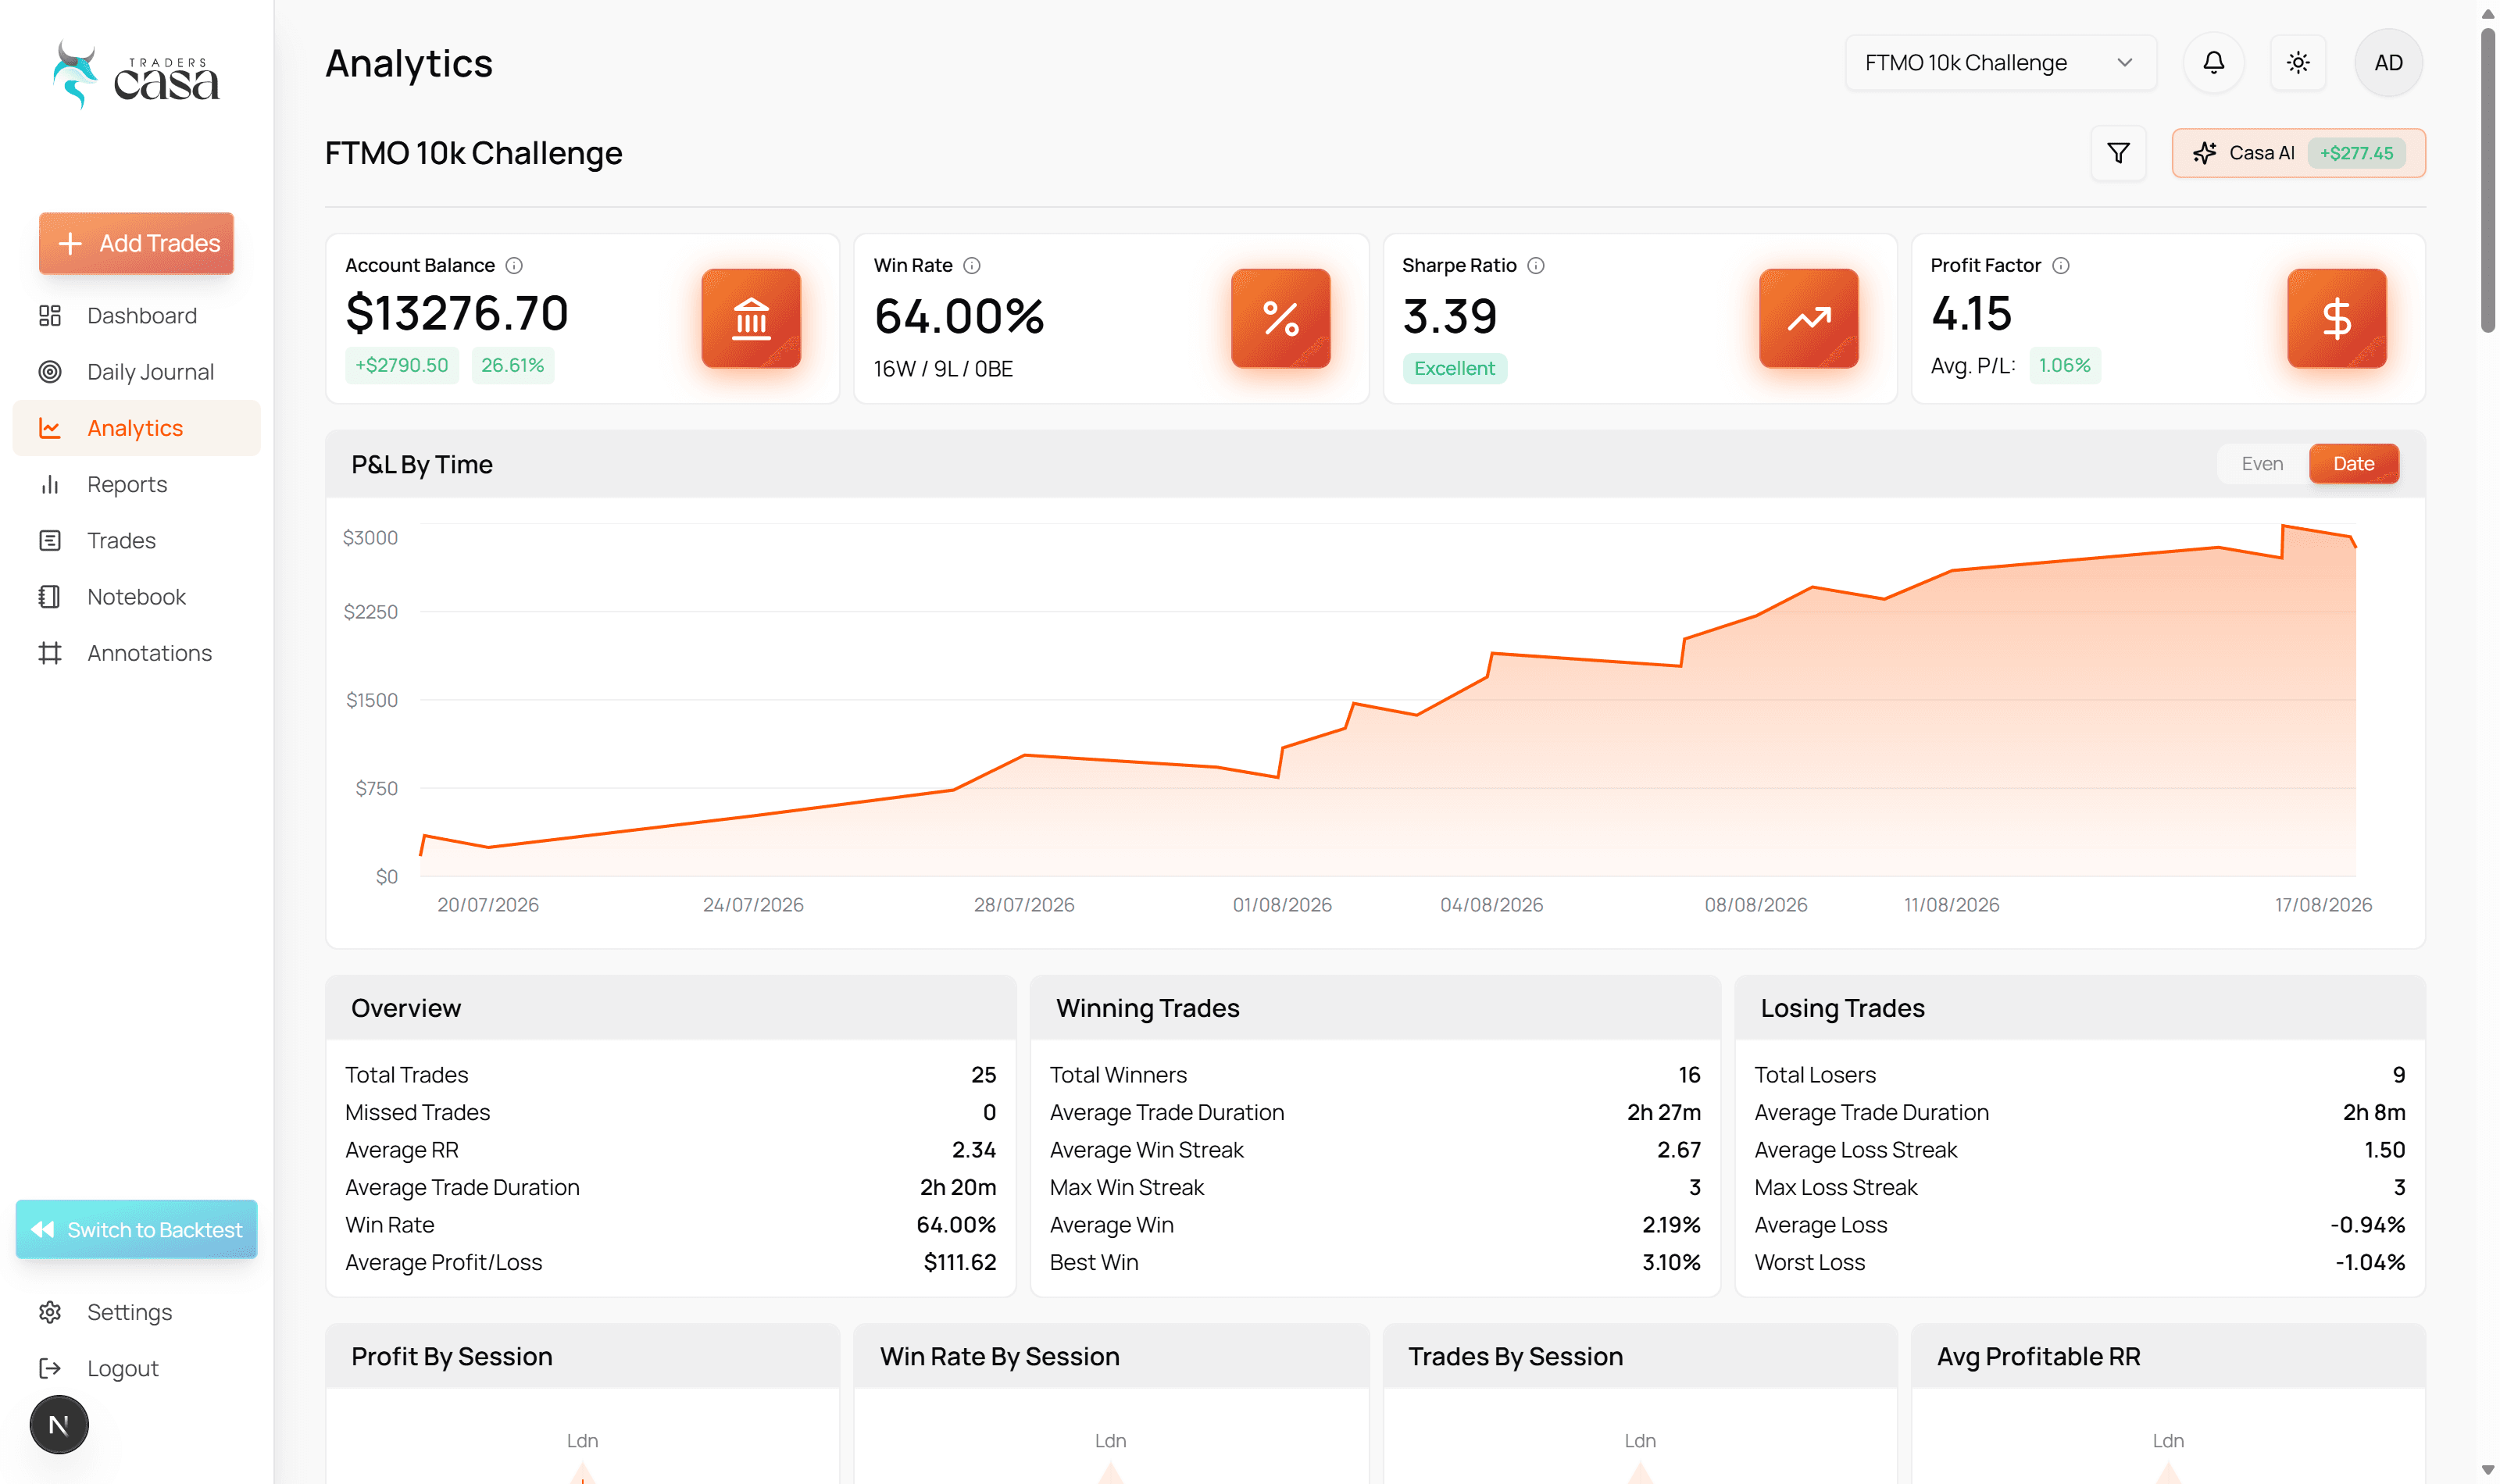
Measure more than your overall P&L
A headline result tells you what happened, never which part of your trading produced it.
Knowing that you made or lost money over 300 trades is useful. It does not tell you which part of your trading produced that result.
Traders Casa gives you more than 300 filterable analytics across your recorded trades. The point is not to put more statistics on one screen. It is to let you examine the record from enough angles to find where the numbers change.
Performance metrics
The underlying numbers behind the result, rather than a single headline figure.
Overview and loss analytics
Separate the broad result from the parts of the record that deserve closer inspection.
Profit and loss graph
See how the result developed across the period instead of reducing it to one number.
Consistency tracker
Check whether the result arrived steadily or came from a handful of outliers.
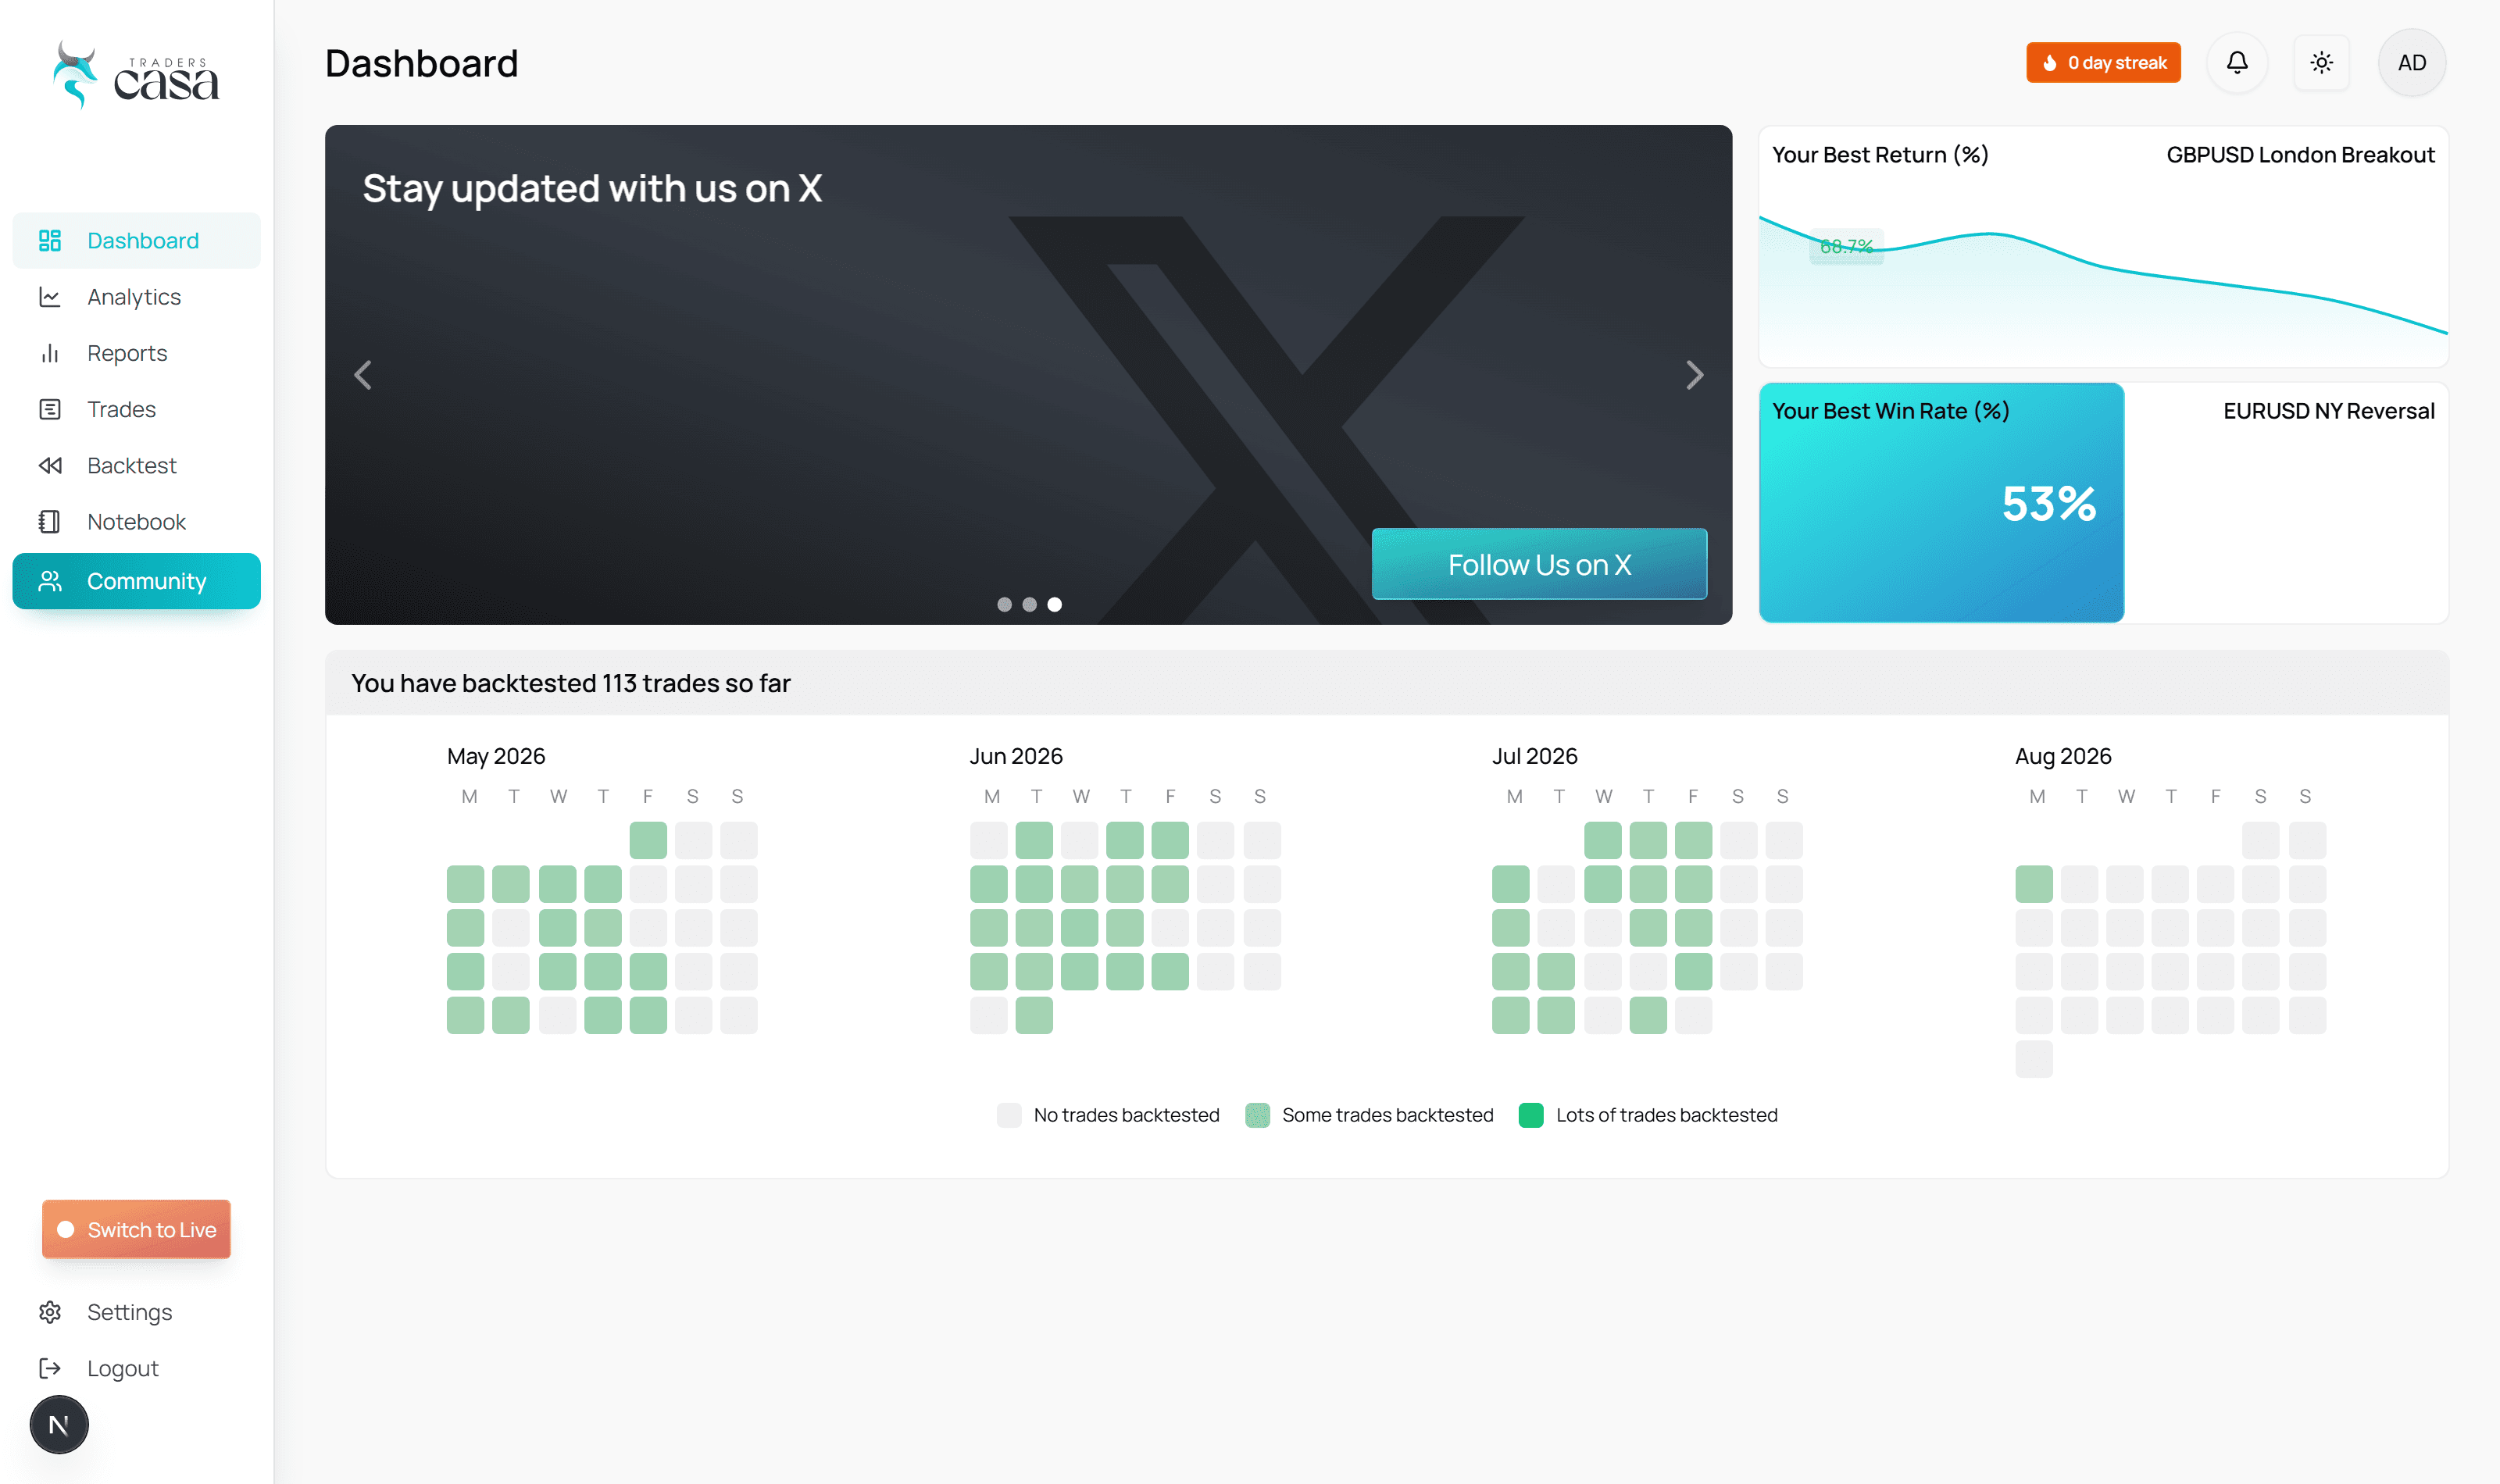
Casa AI can analyse the results as well. It gives you another way to interrogate what the data is showing, rather than requiring you to work through every metric manually.
Traders Casa has more than 800,000 users, with over 20,000,000 backtested trades and 1,600,000 sessions created.
Reports turn the analytics into a performance review
Analytics are for investigating. Reports are for reading the conclusion.
Analytics are useful when you want to investigate. Reports are useful when you want the important parts of that investigation organised into a clearer view. That is why the analytics suite and the reports pages belong together.
Traders Casa provides dedicated analytics and reports for both sides of your trading record. You can review live trading after the trades have been recorded, and review the results produced by your backtests, without moving to a separate analysis process.
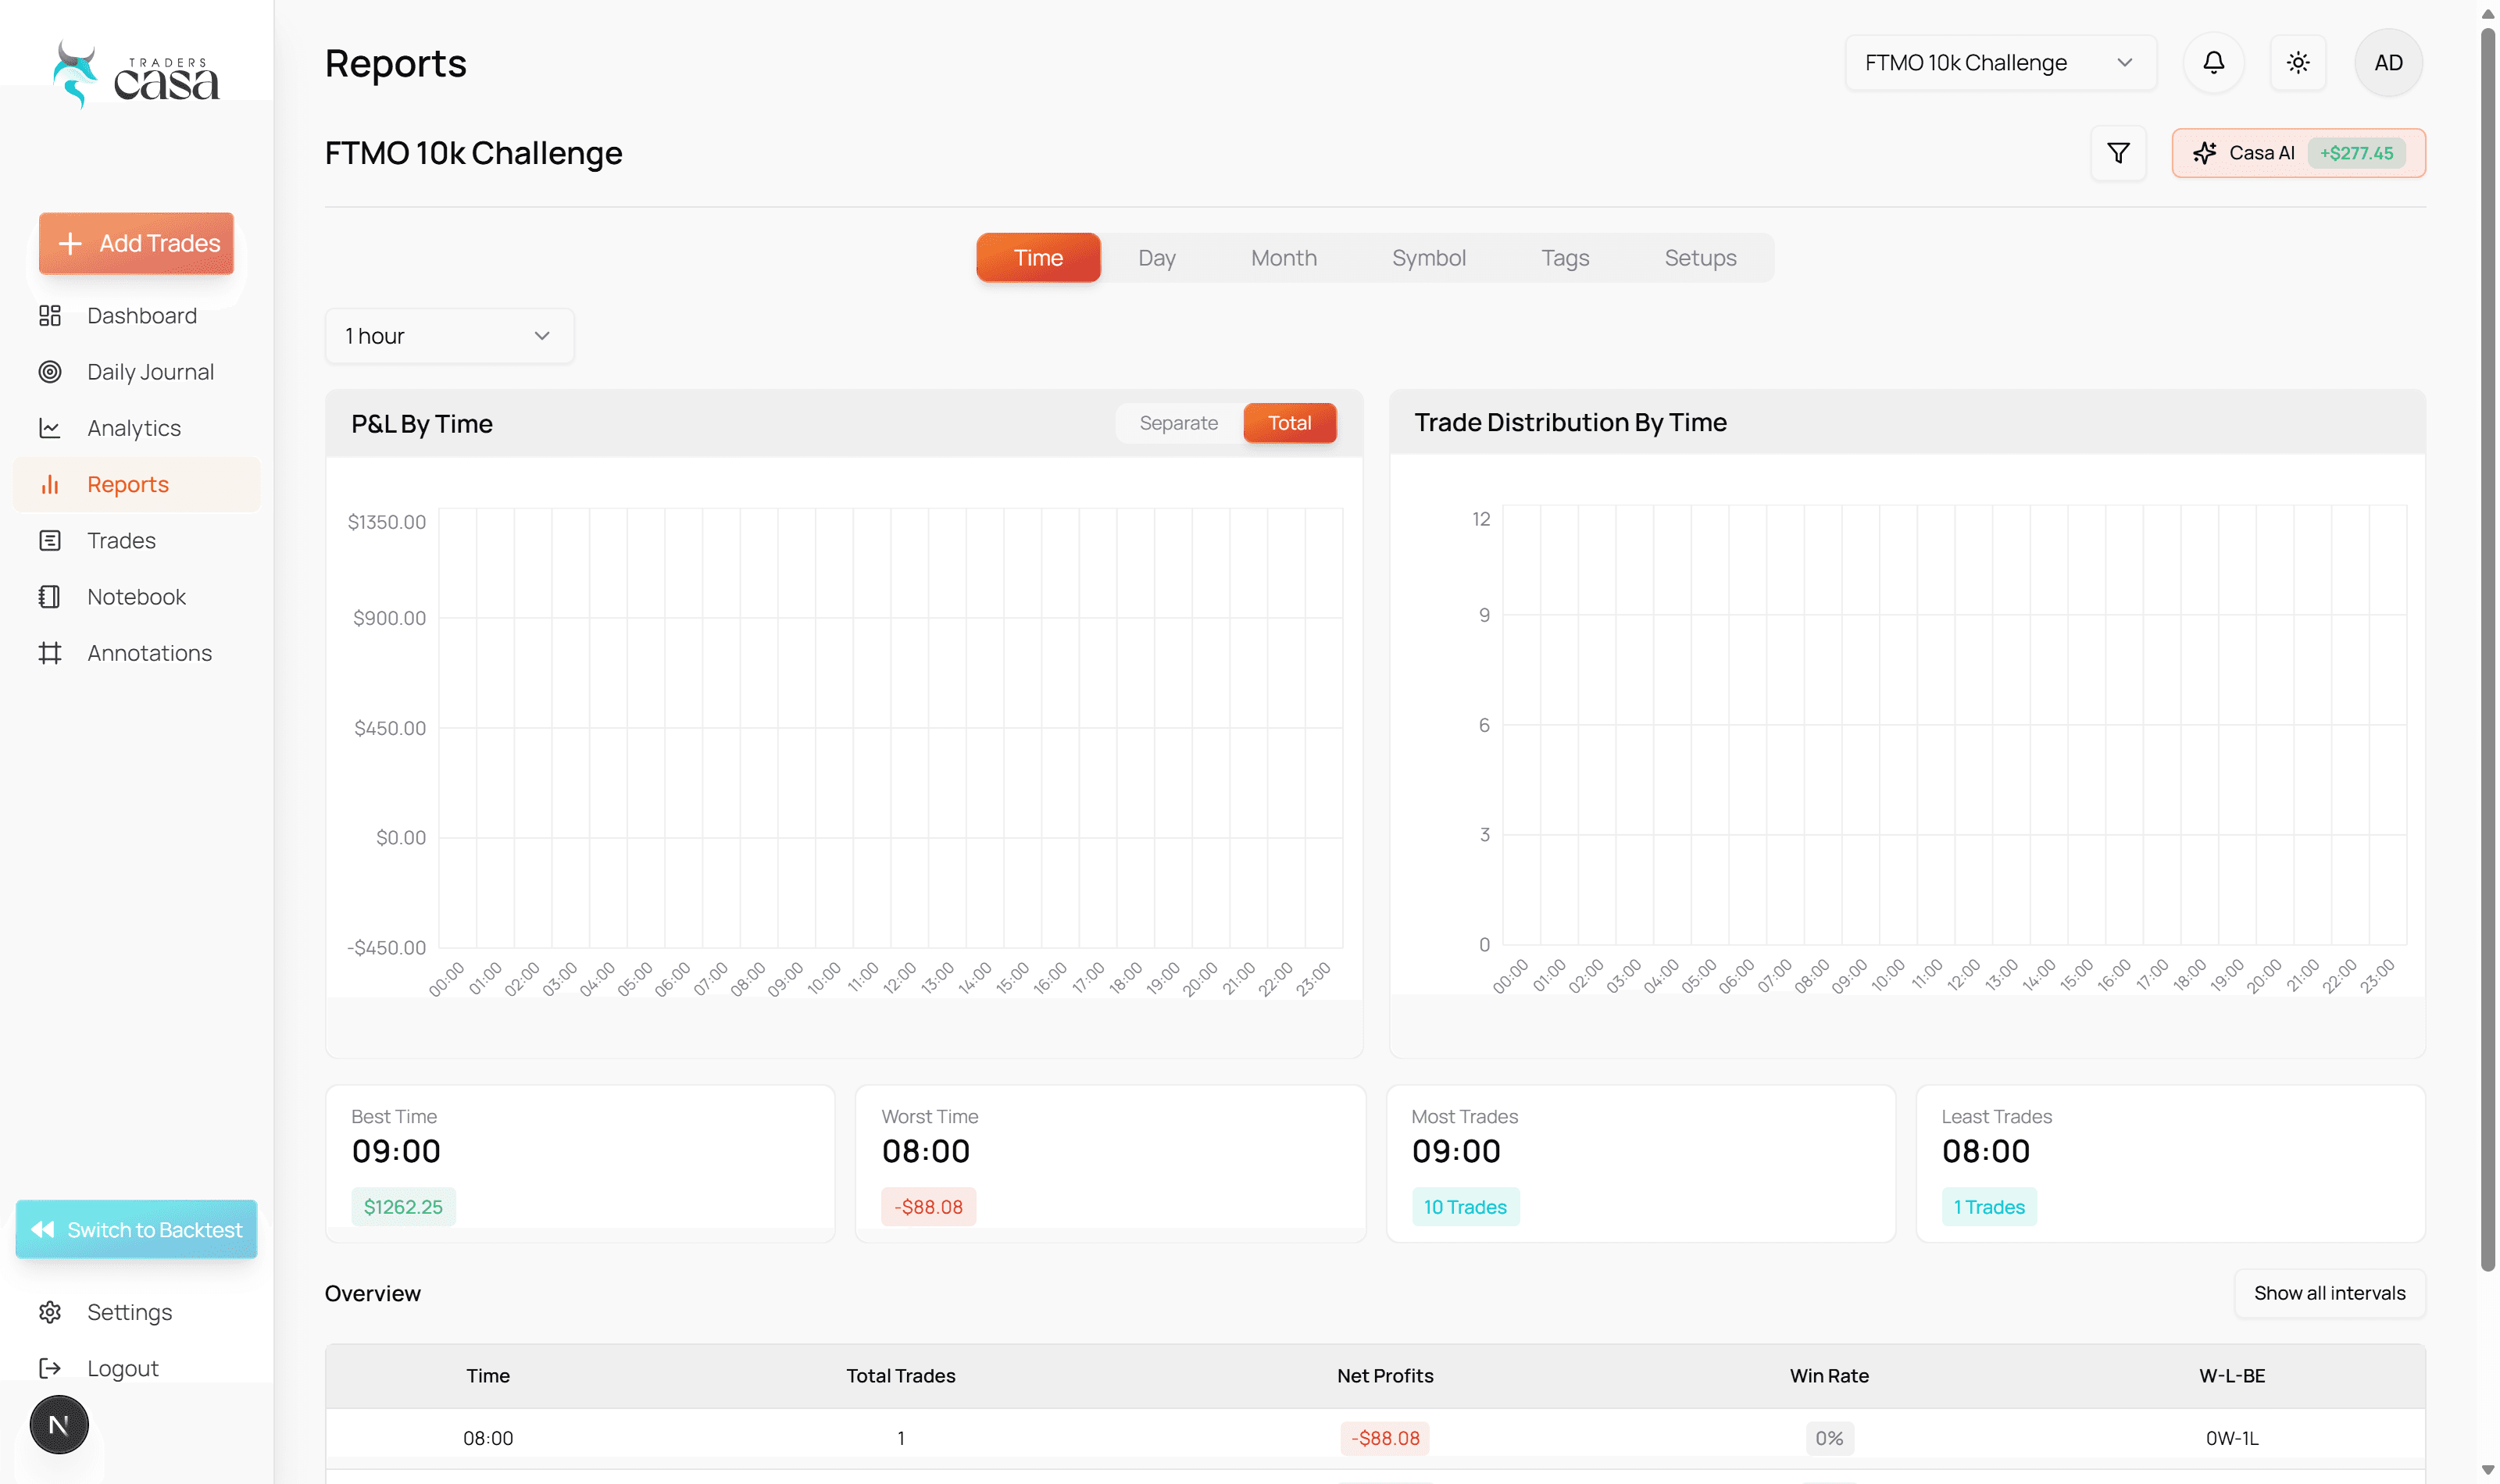
The overview gives you the broader picture. Loss analytics concentrate on what is going wrong. The profit and loss graph shows how the result developed, while the consistency tracker helps you inspect whether that result was produced steadily or unevenly.
Casa AI adds interpretation to those results. It does not change your trading record or promise what happens next. It helps you examine the record you already have and identify patterns worth investigating further.
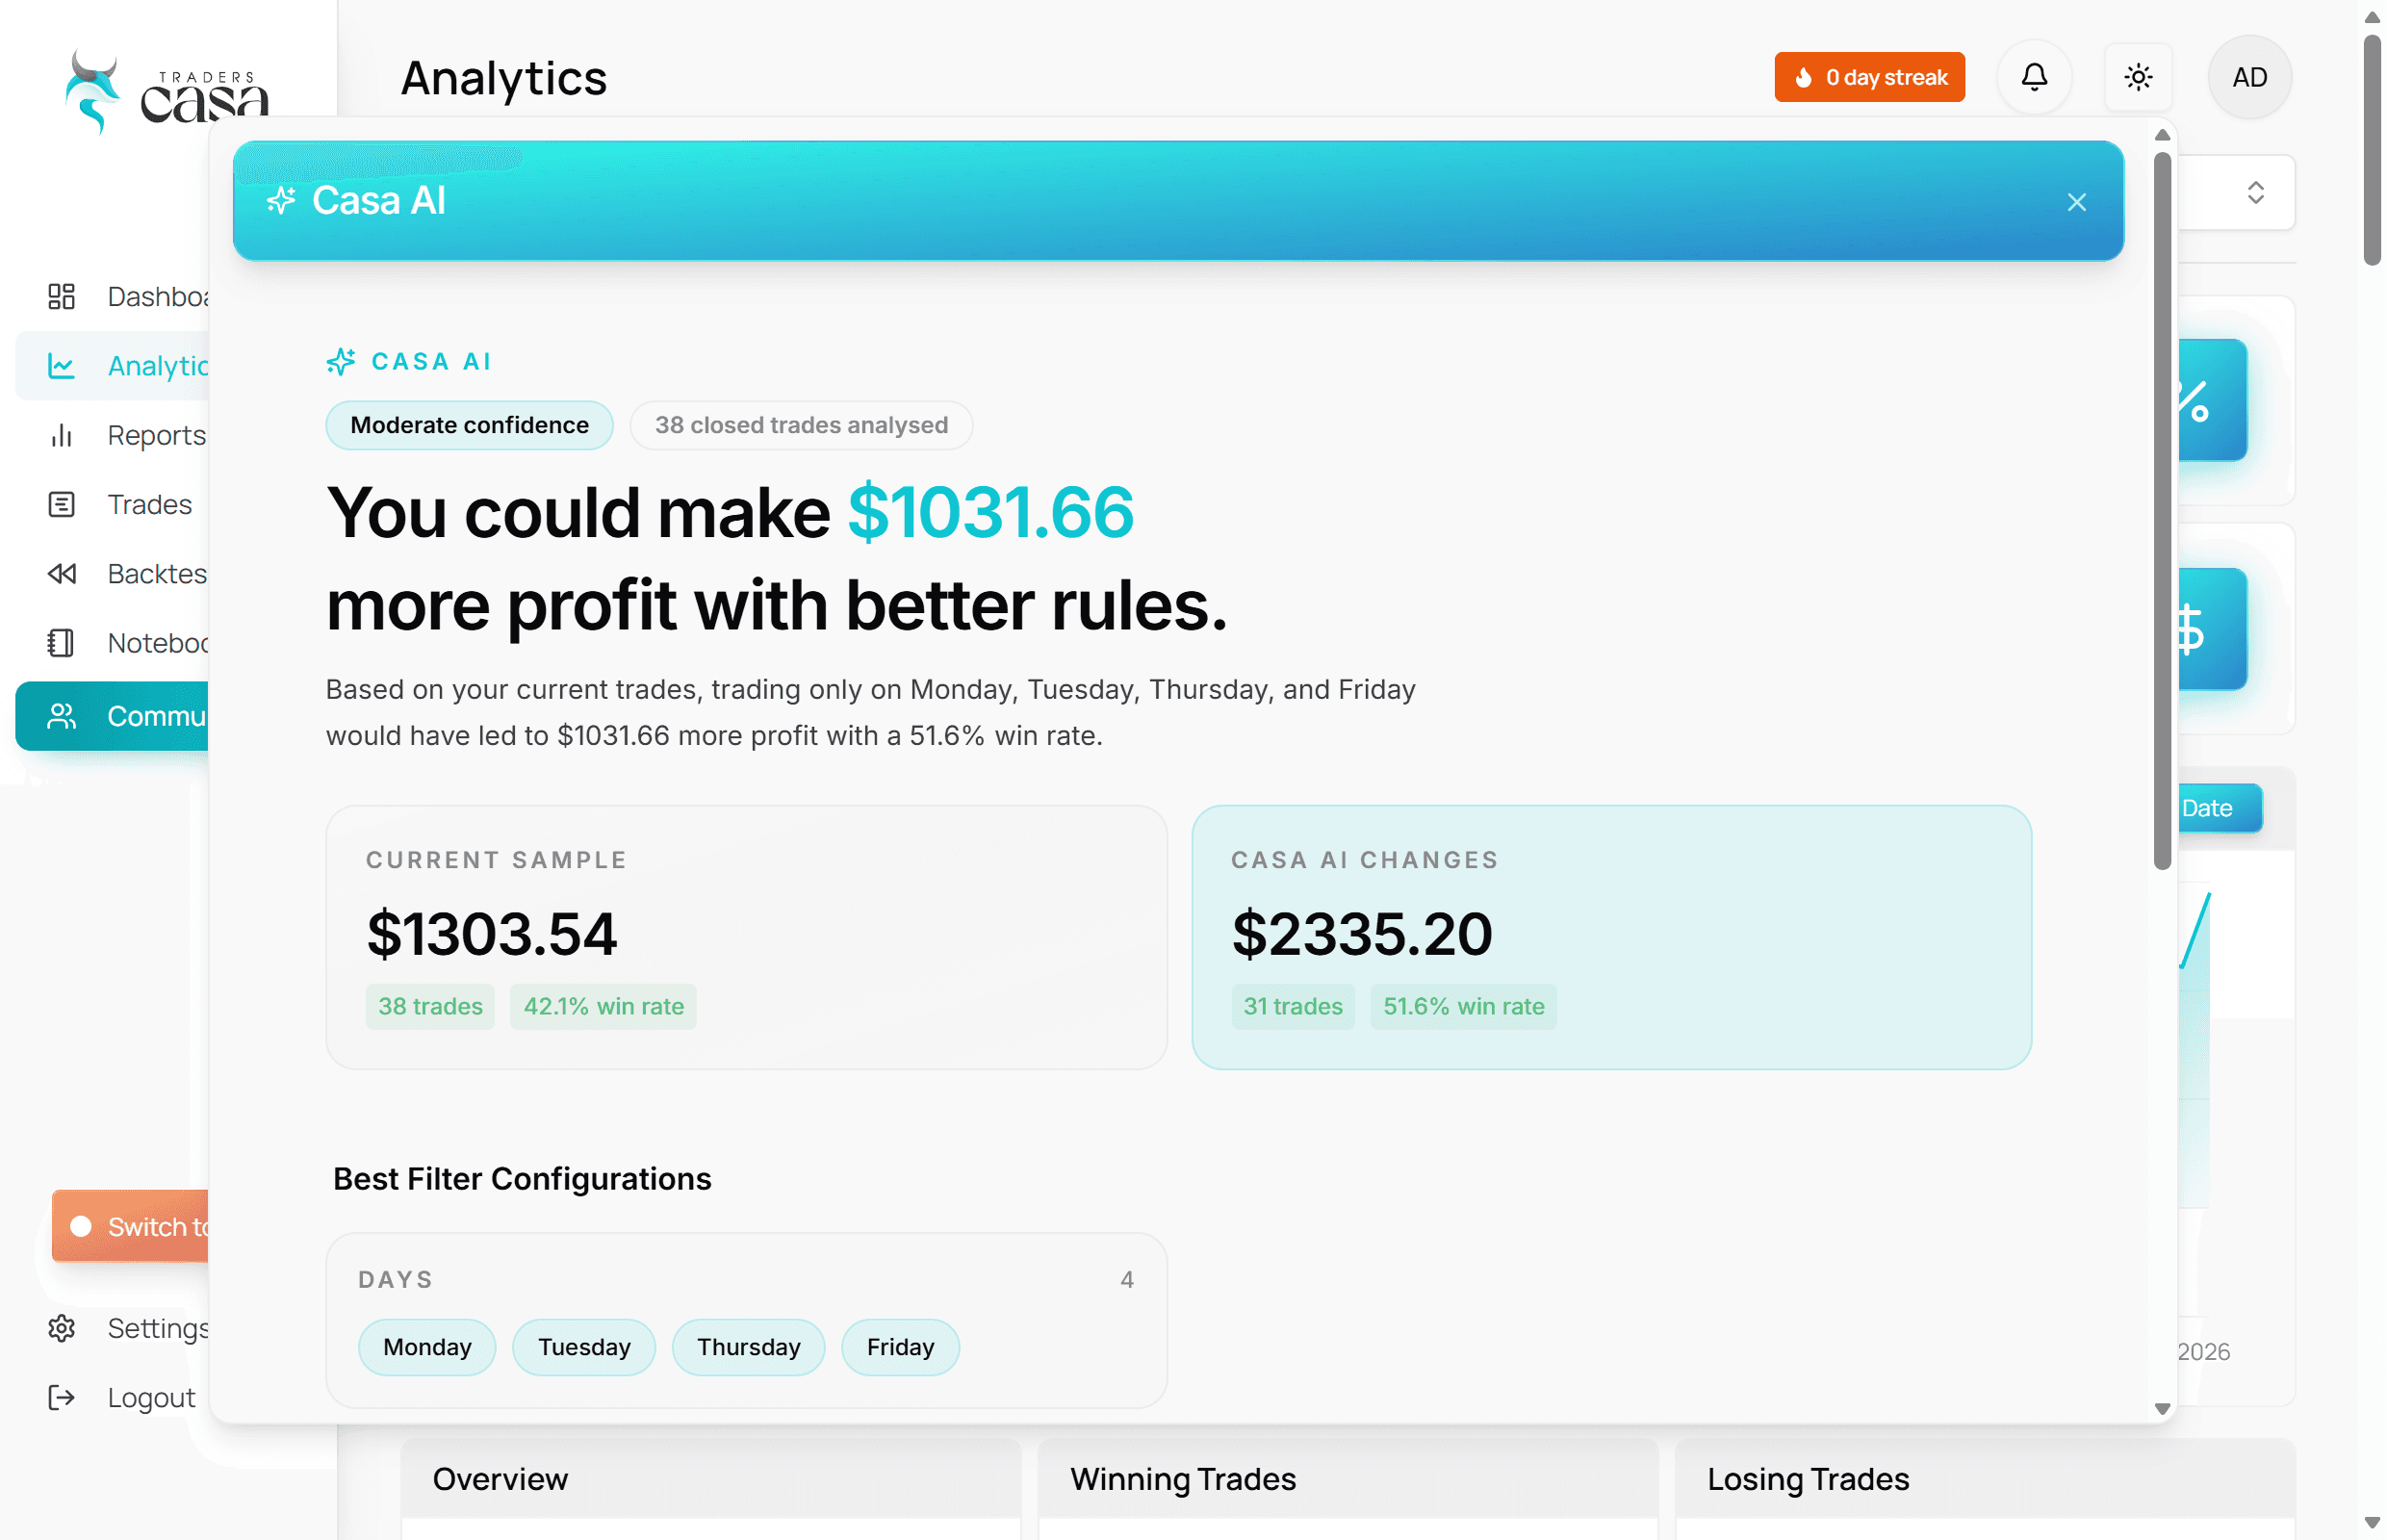
The result is a reporting layer built around analysis, not simply a broker statement with more columns.
Filter your trades until the specific problem appears
A fixed dashboard only answers the questions its designer decided to ask.
The full analytics suite is filterable, so you can isolate a particular part of your trading and see what happens to the numbers. Instead of asking how you are performing, you can narrow the question to a particular condition, session or setup.
That distinction matters when the overall result is hiding two very different groups of trades.
One setup carrying another
A strong setup can mask one that loses money every month.
A harmless looking condition
Some conditions produce losses that disappear inside the total P&L.
A session that feels productive
Separate it from the rest of the record and it can look very different.
Filters you keep
Save a useful analysis and reapply it as your record grows, rather than rebuilding it.
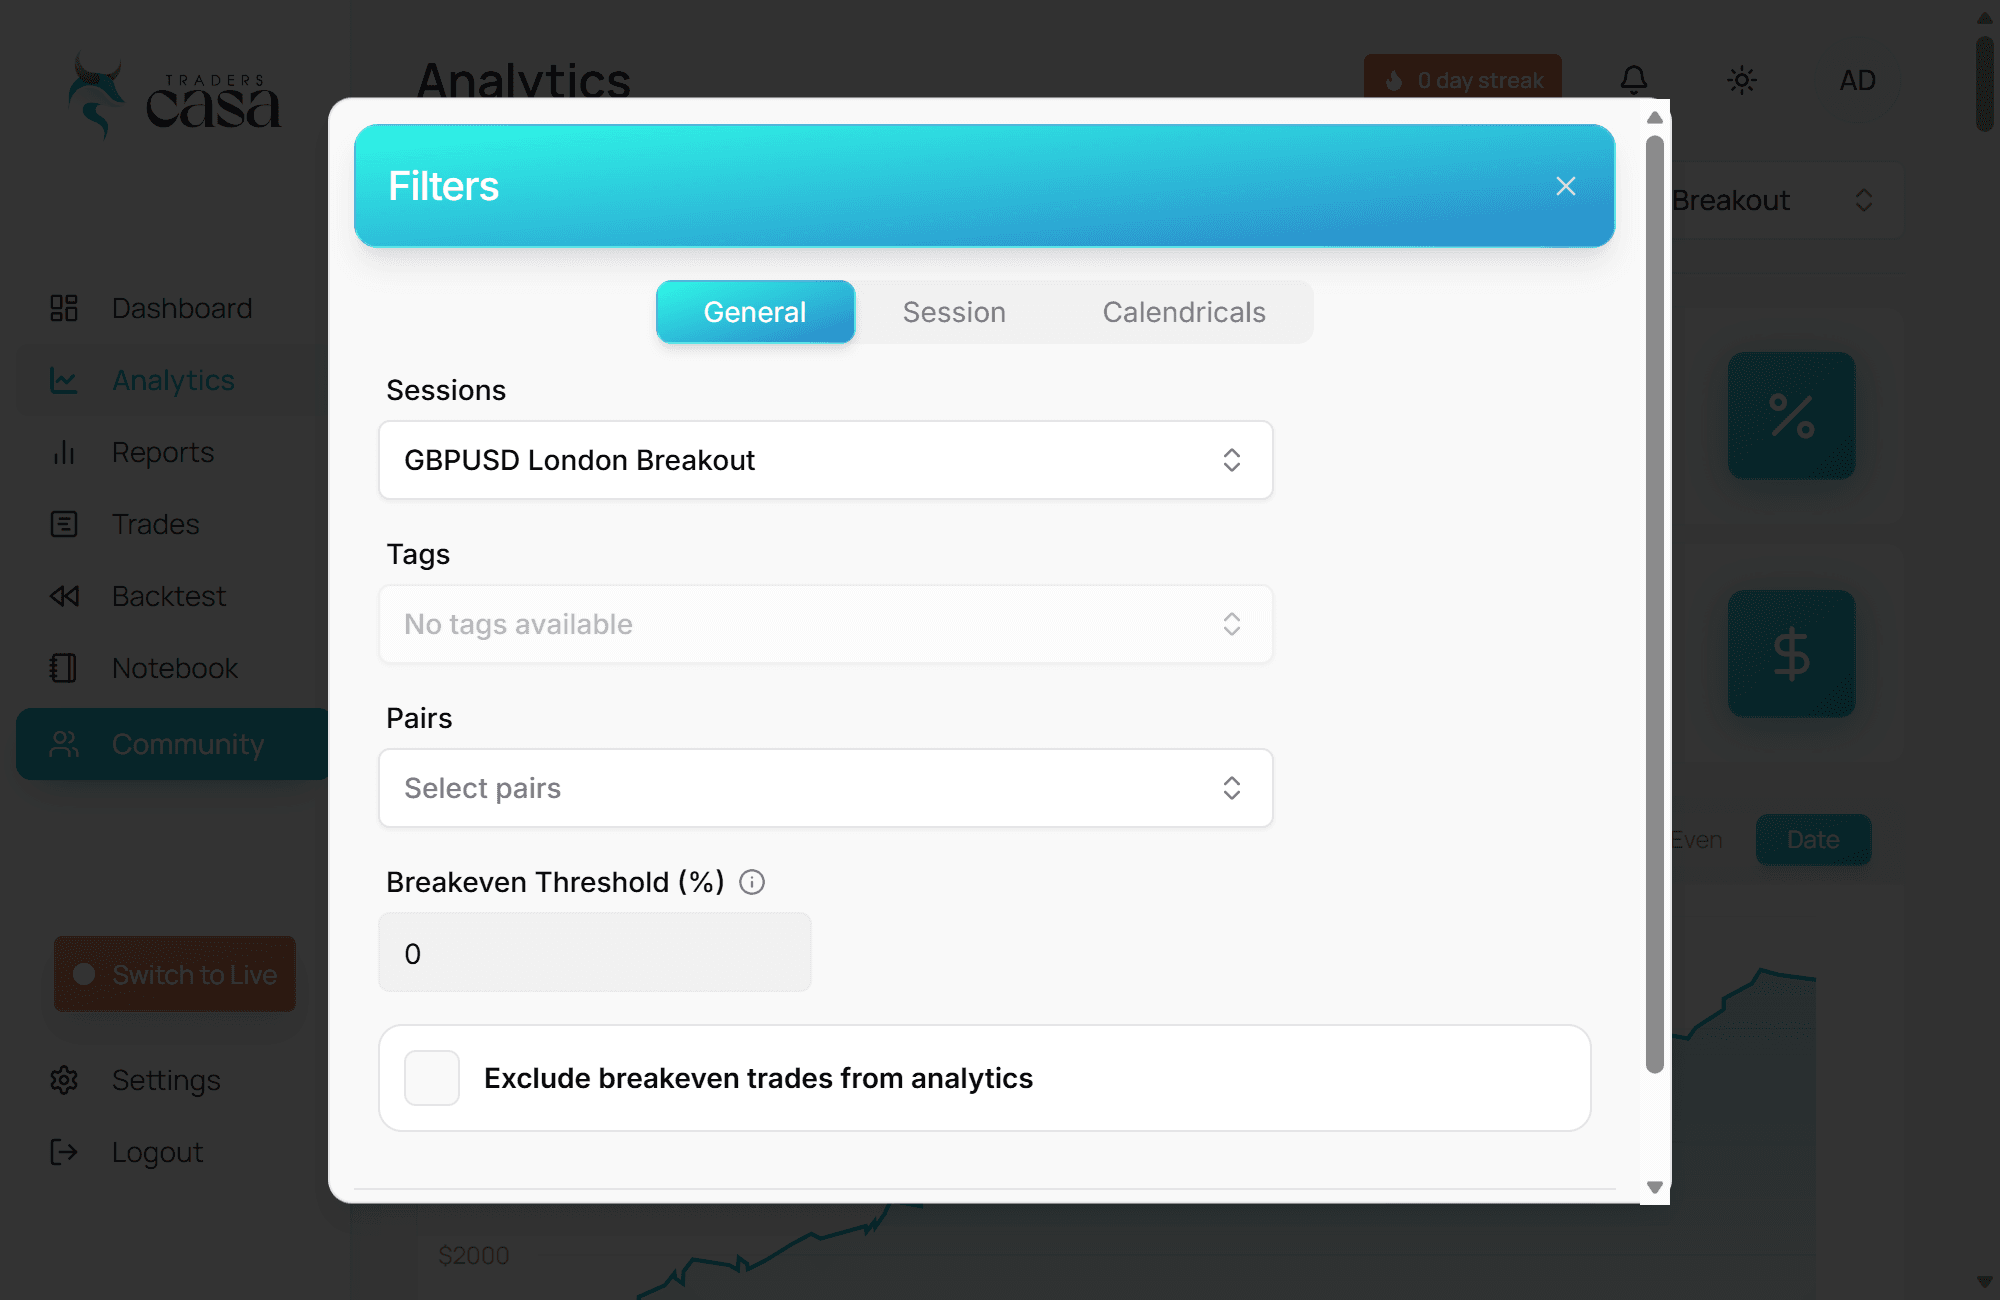
That is the mechanism behind the analytics. You are not being given one generic definition of good trading. You are filtering your own trades until you can see which parts of your own process are associated with the result.
Run the same analysis across backtests and live trades
Two records, one analytical framework.
Backtesting and live trading answer different questions, but analysing them with completely different systems makes comparison harder than it needs to be. Traders Casa applies the same approach to both.
Your backtest analytics and reports let you examine what happened across simulated historical trades. Your live analytics and reports let you examine what happened once trades were taken in the market.
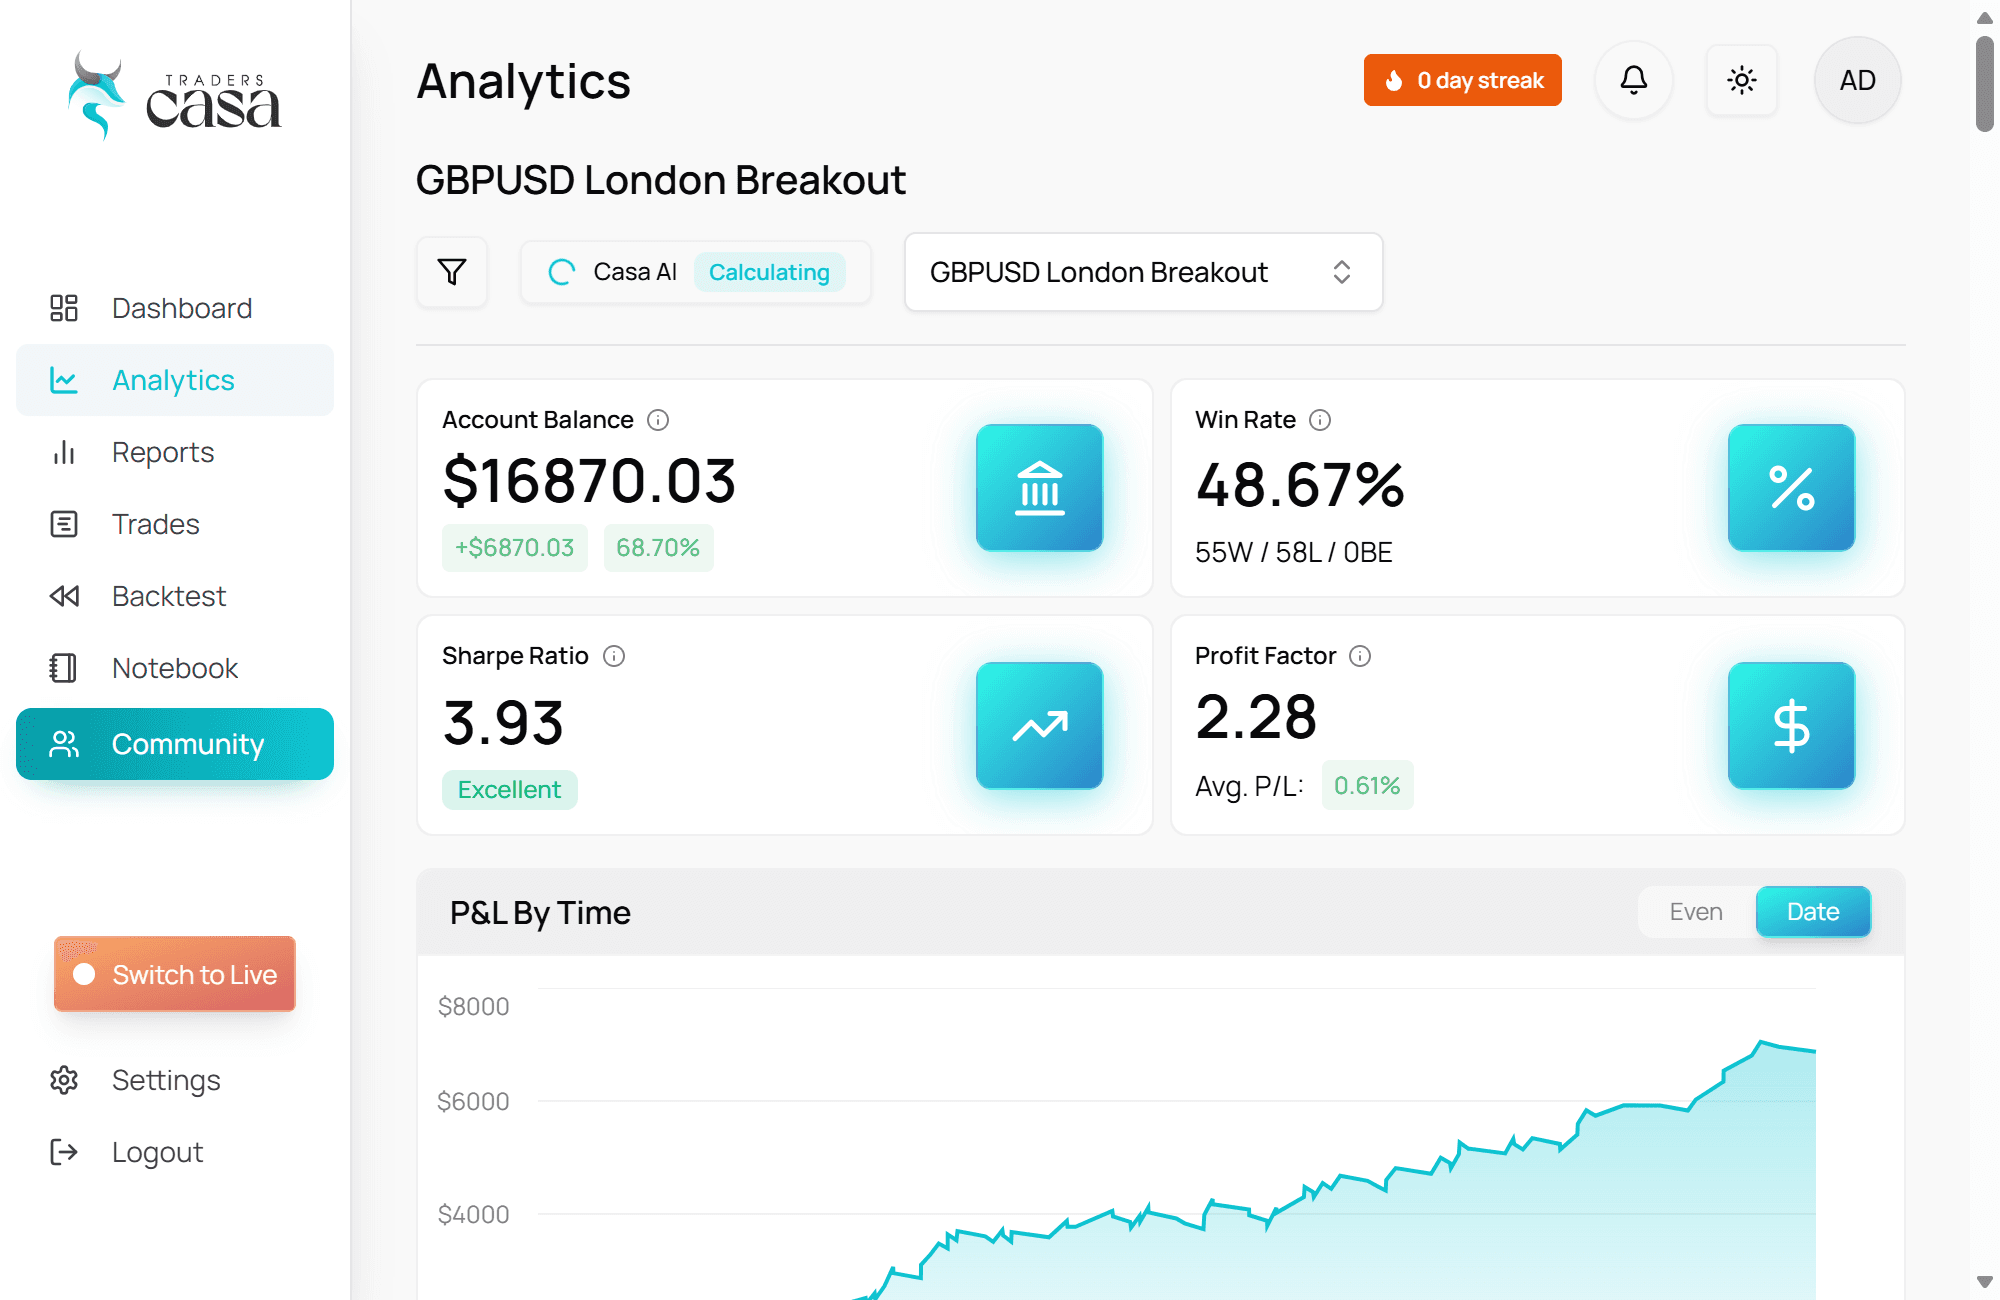
You can investigate a setup in a backtest, isolate conditions within those results, then examine recorded live trades using the same kind of analysis. You are not trying to reconcile one set of spreadsheet calculations with a separate broker report.
This does not mean backtested results will carry over into live trading. It means you can inspect both records with comparable tools, making differences easier to find and investigate. For a trader with hundreds of recorded trades, that comparison can be more useful than another top line win rate.
Who it is for
Traders Casa analytics is for forex and futures traders who already have enough recorded trades to analyse, but still cannot explain their overall result.
If you have outgrown broker statements and spreadsheet pivot tables, and you want to isolate what is happening inside your trading record rather than collect more statistics, this is the part of Traders Casa built for that job.
Trading analytics FAQs
What analytics does Traders Casa include?
Traders Casa includes more than 300 filterable analytics across your recorded trades, alongside overview and loss analysis, a profit and loss graph, consistency tracking and Casa AI insights. There are dedicated analytics and reports pages for live trading and backtesting, designed to let you move from a broad performance result to narrower questions about particular conditions, sessions and setups.
How is this different from a trading journal?
A trading journal records and organises your trades. This feature starts with those recorded trades and asks what the numbers tell you. The focus here is analysis after recording: performance metrics, reports, filtered subsets of trades, loss inspection and comparison across parts of your record. It complements the journal rather than replacing the job of recording trades.
Can I analyse backtests and live trades in the same way?
Yes. Traders Casa provides analytics and reporting for both backtested and live trading records, using the same underlying approach. That lets you investigate conditions or setups in a backtest and then examine your live record with comparable tools. It does not assume backtested performance predicts live results, it just makes both easier to inspect and compare.
Why use filters instead of a standard trading dashboard?
A standard dashboard gives you a fixed summary. Filtering lets you change the question. If your overall P&L contains hundreds of trades, the aggregate can hide important differences between subsets. Traders Casa lets you isolate a condition, session or setup, examine its analytics separately, then save that filter for later.
Which Traders Casa plan do I need for trading analytics?
Free includes the profit and loss graph and consistency tracker, so you can start reviewing your recorded performance without upgrading. Basic adds basic analytics, the full overview and loss analytics, plus Casa AI. Pro includes the full filterable analytics suite, backtest reports and live analytics.
More features
All features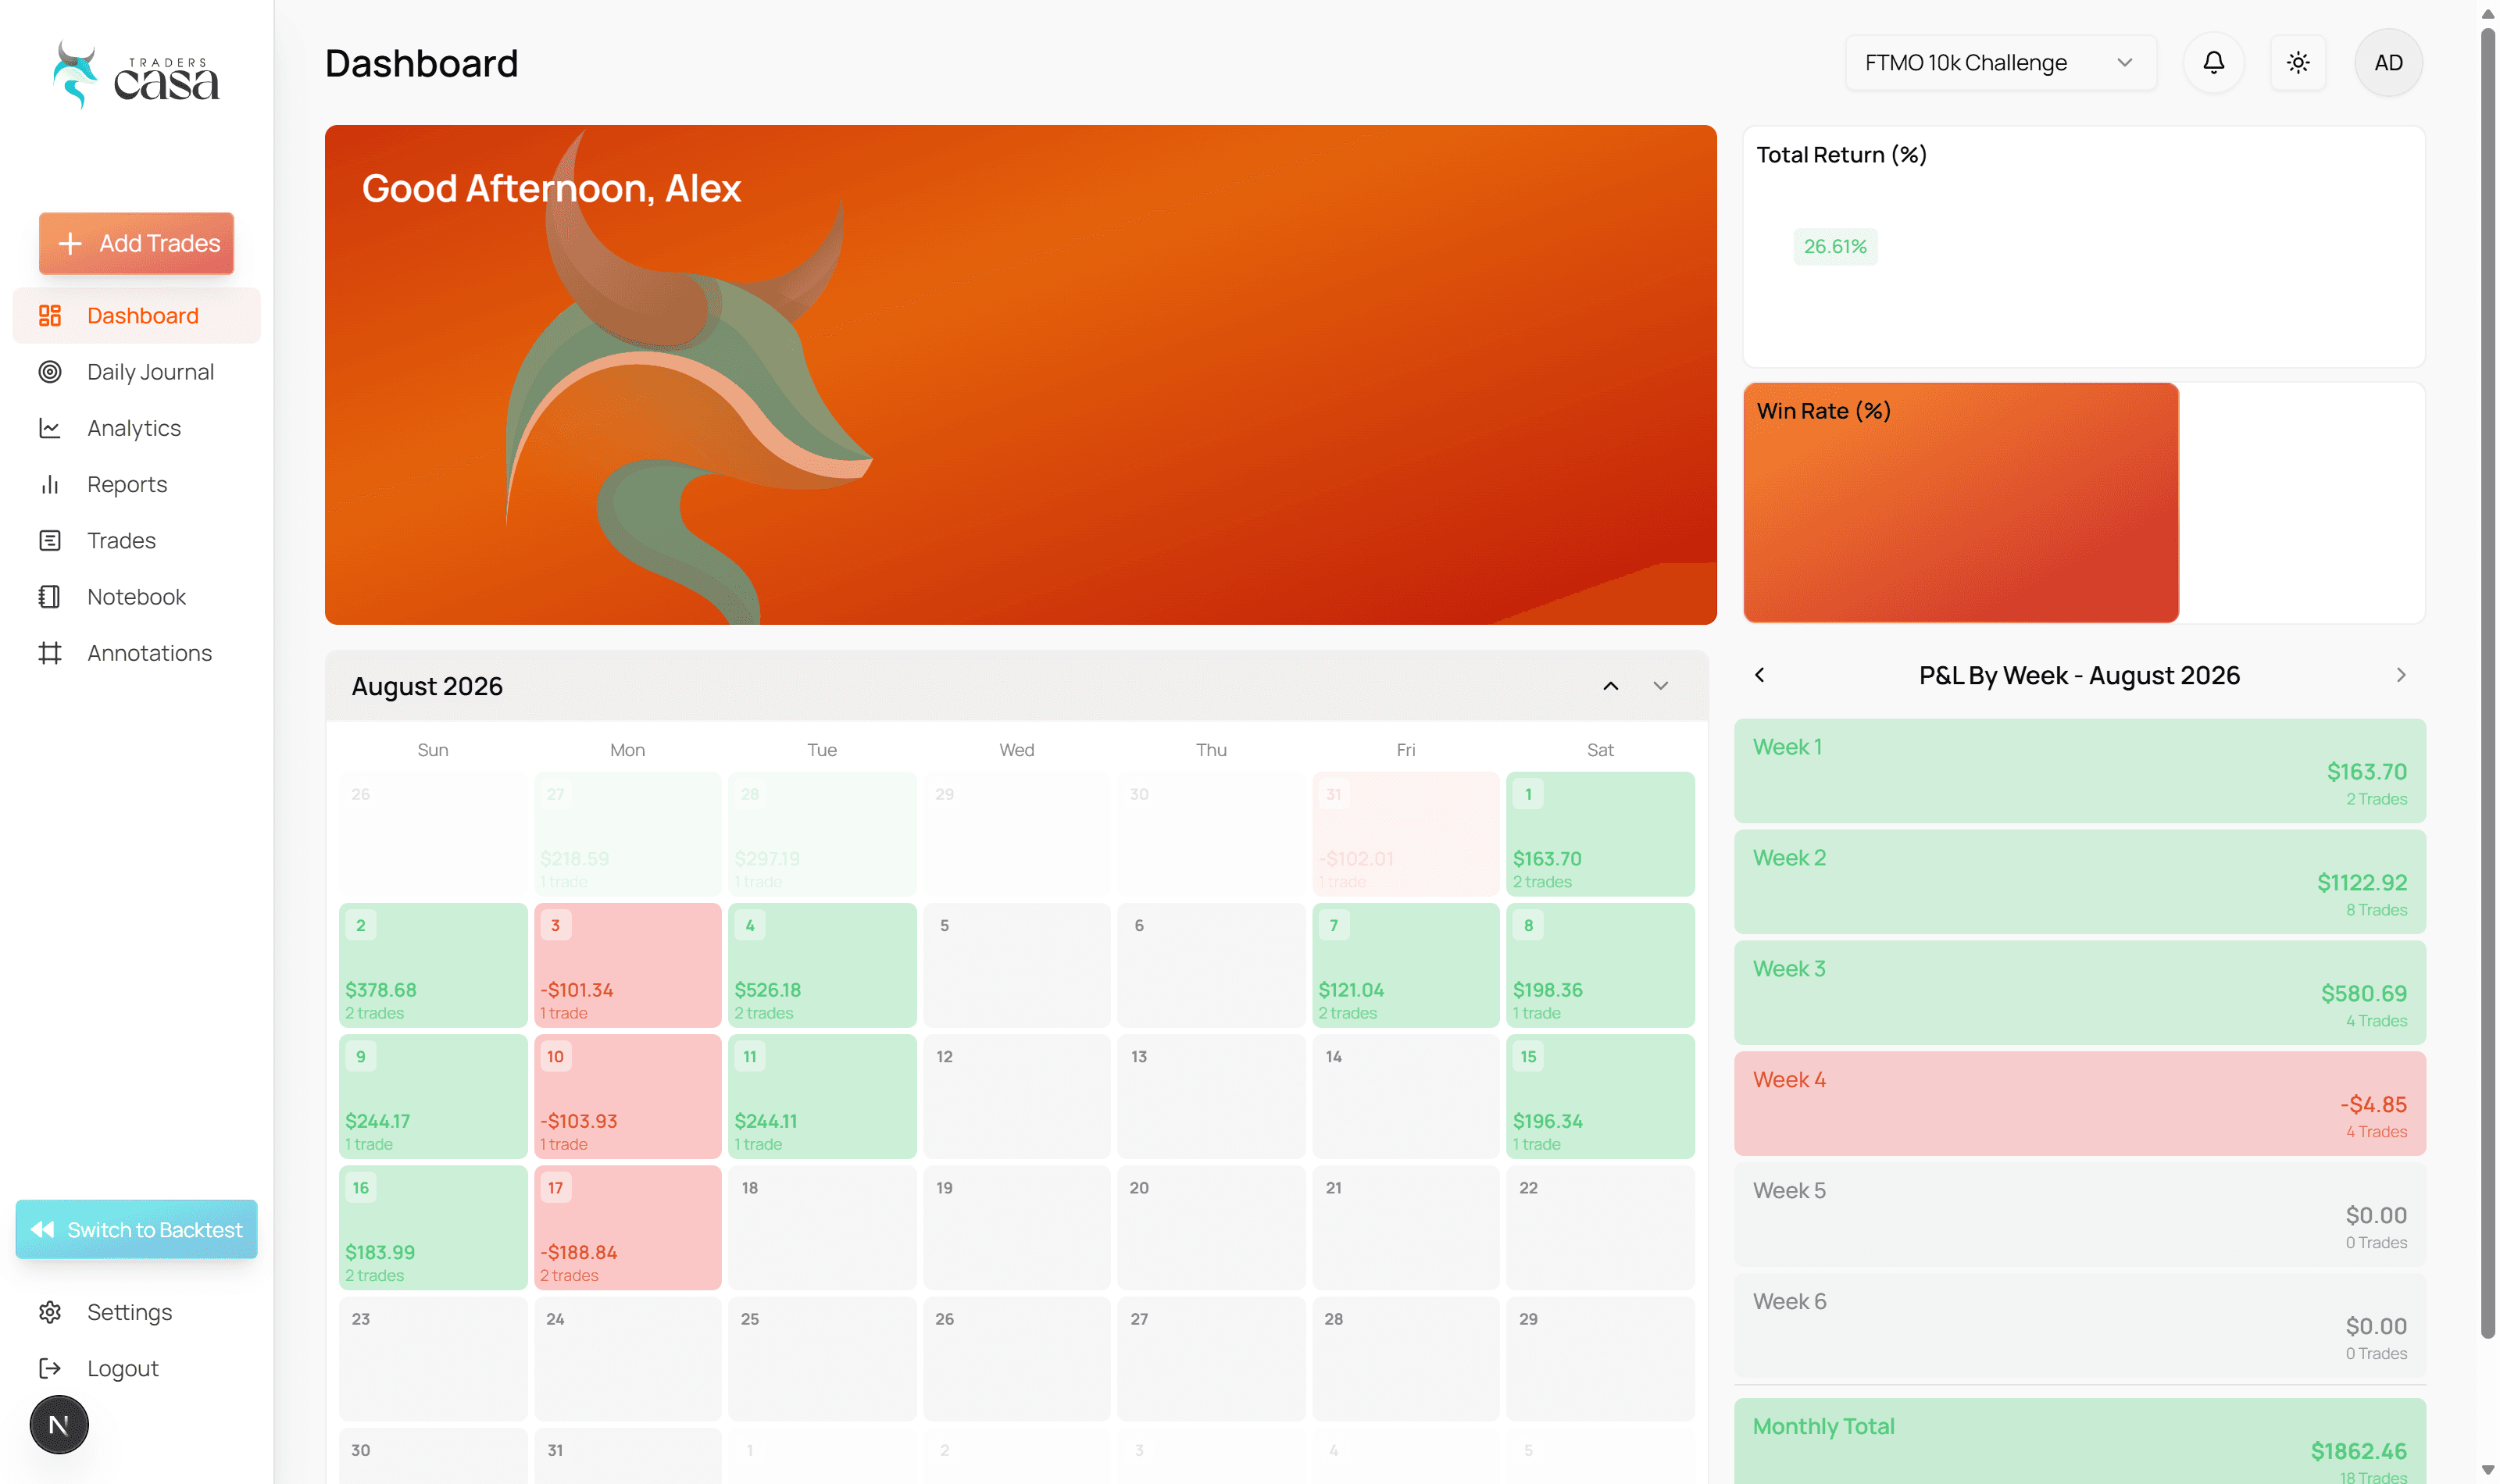

Start on the free plan
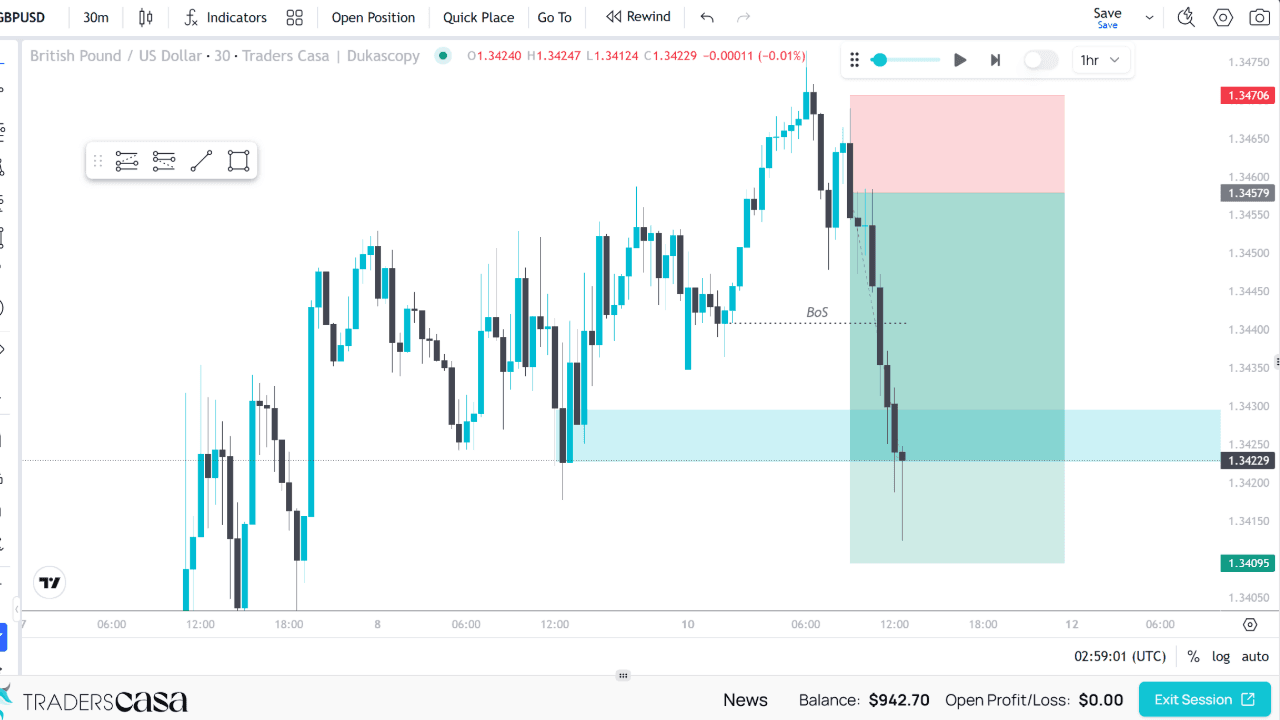
Unlimited backtest sessions on TradingView powered charts, and the free plan never expires. Upgrade when you need the rest.