
Backtesting spreadsheet
A free backtesting spreadsheet that tells you if your strategy works
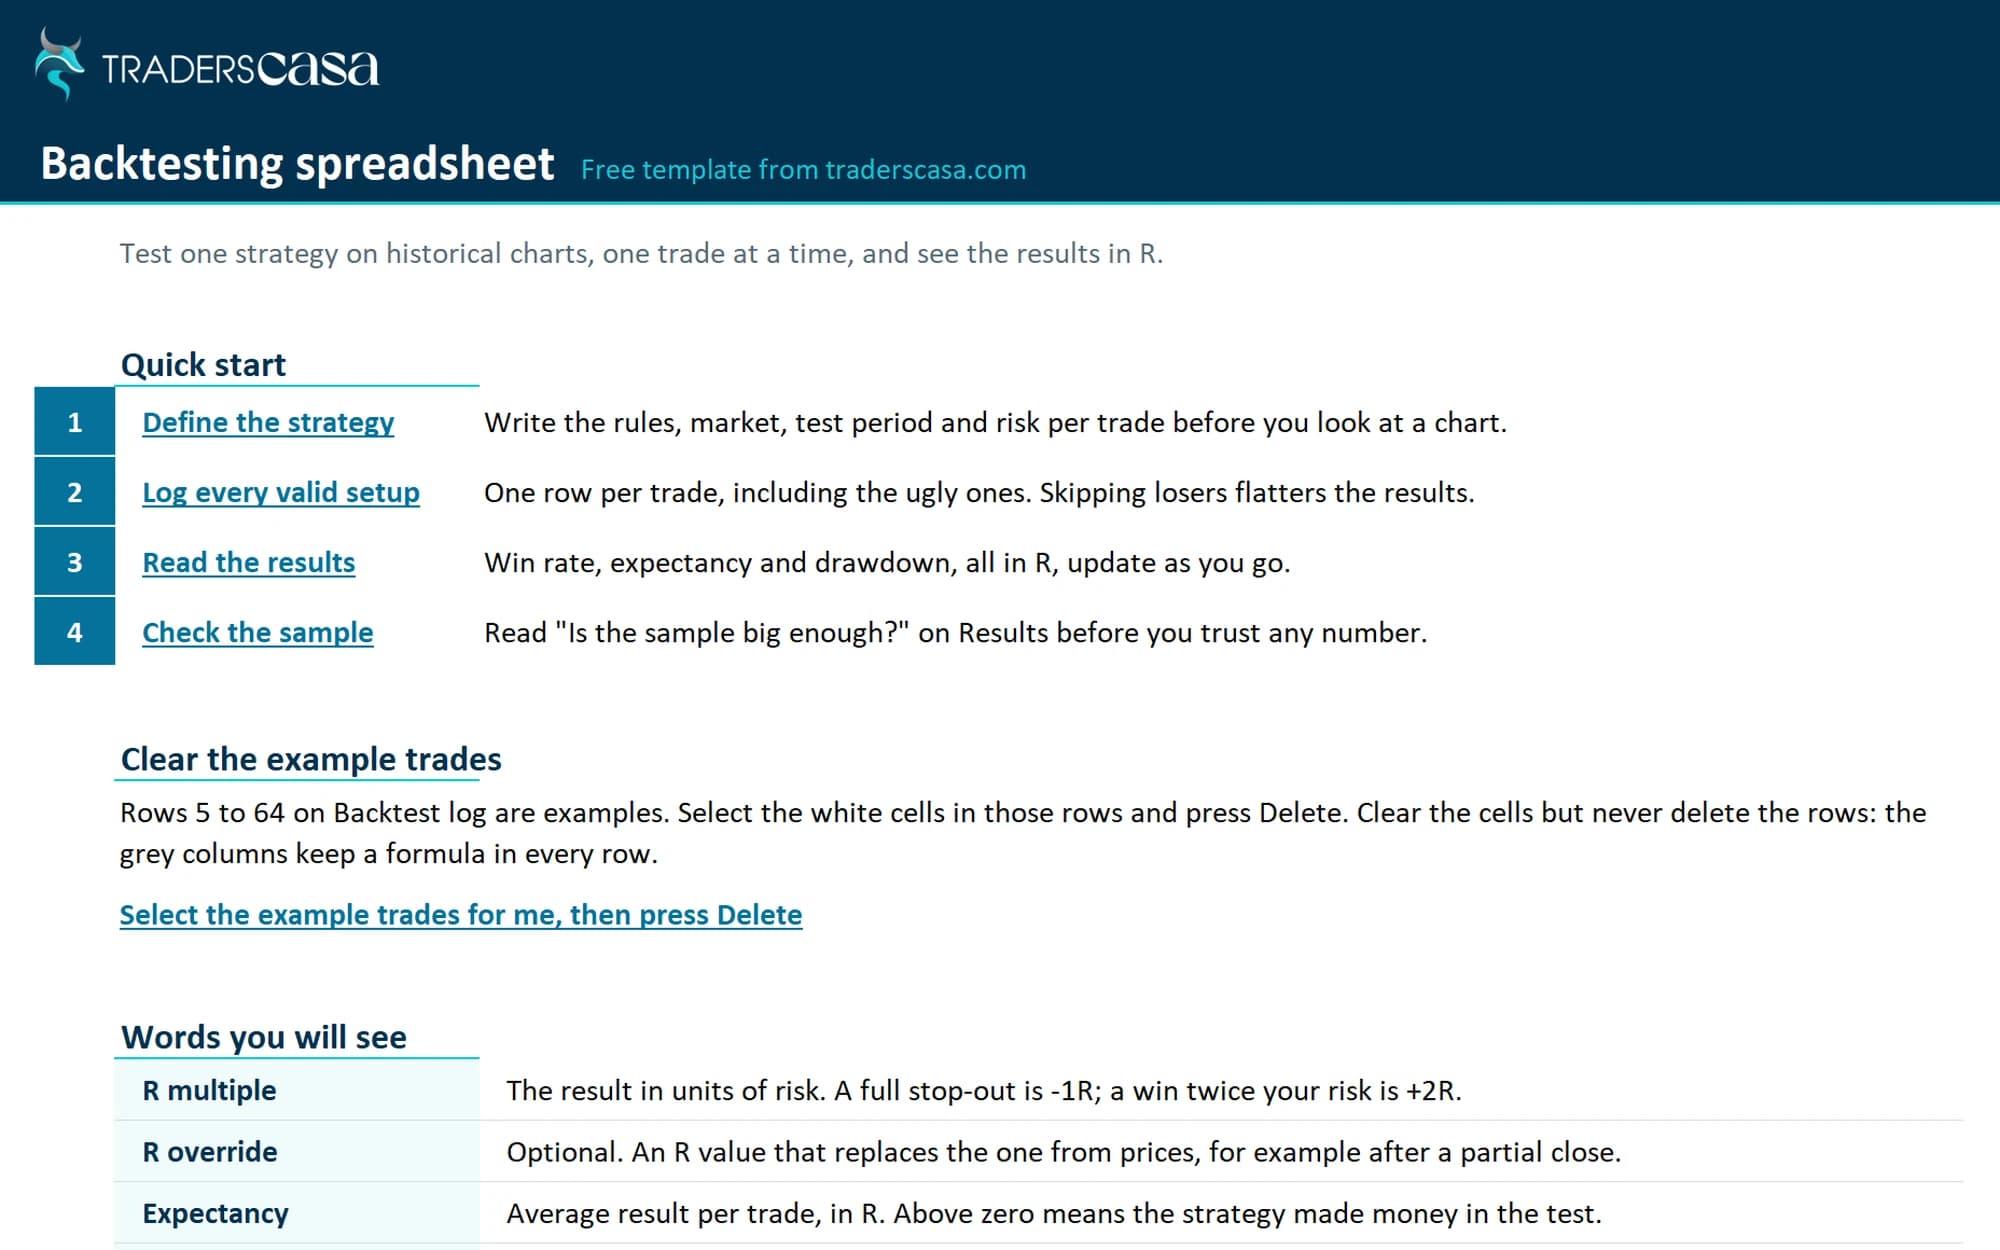
This backtesting spreadsheet logs your historical trades and calculates expectancy, profit factor, drawdown and an equity curve in R. It also shows when your sample is too small to trust. Use it in Excel, Google Sheets or LibreOffice. No email needed.
- No email, account or card
- Free
- Compare results without account size
- In R
- Confidence ranges for your results
- 95%
- Excel, Google Sheets and LibreOffice
- 3 apps
backtesting-spreadsheet.xlsx
Download the spreadsheet
Get the full workbook or just the log columns for importing elsewhere.
Using Google Sheets?
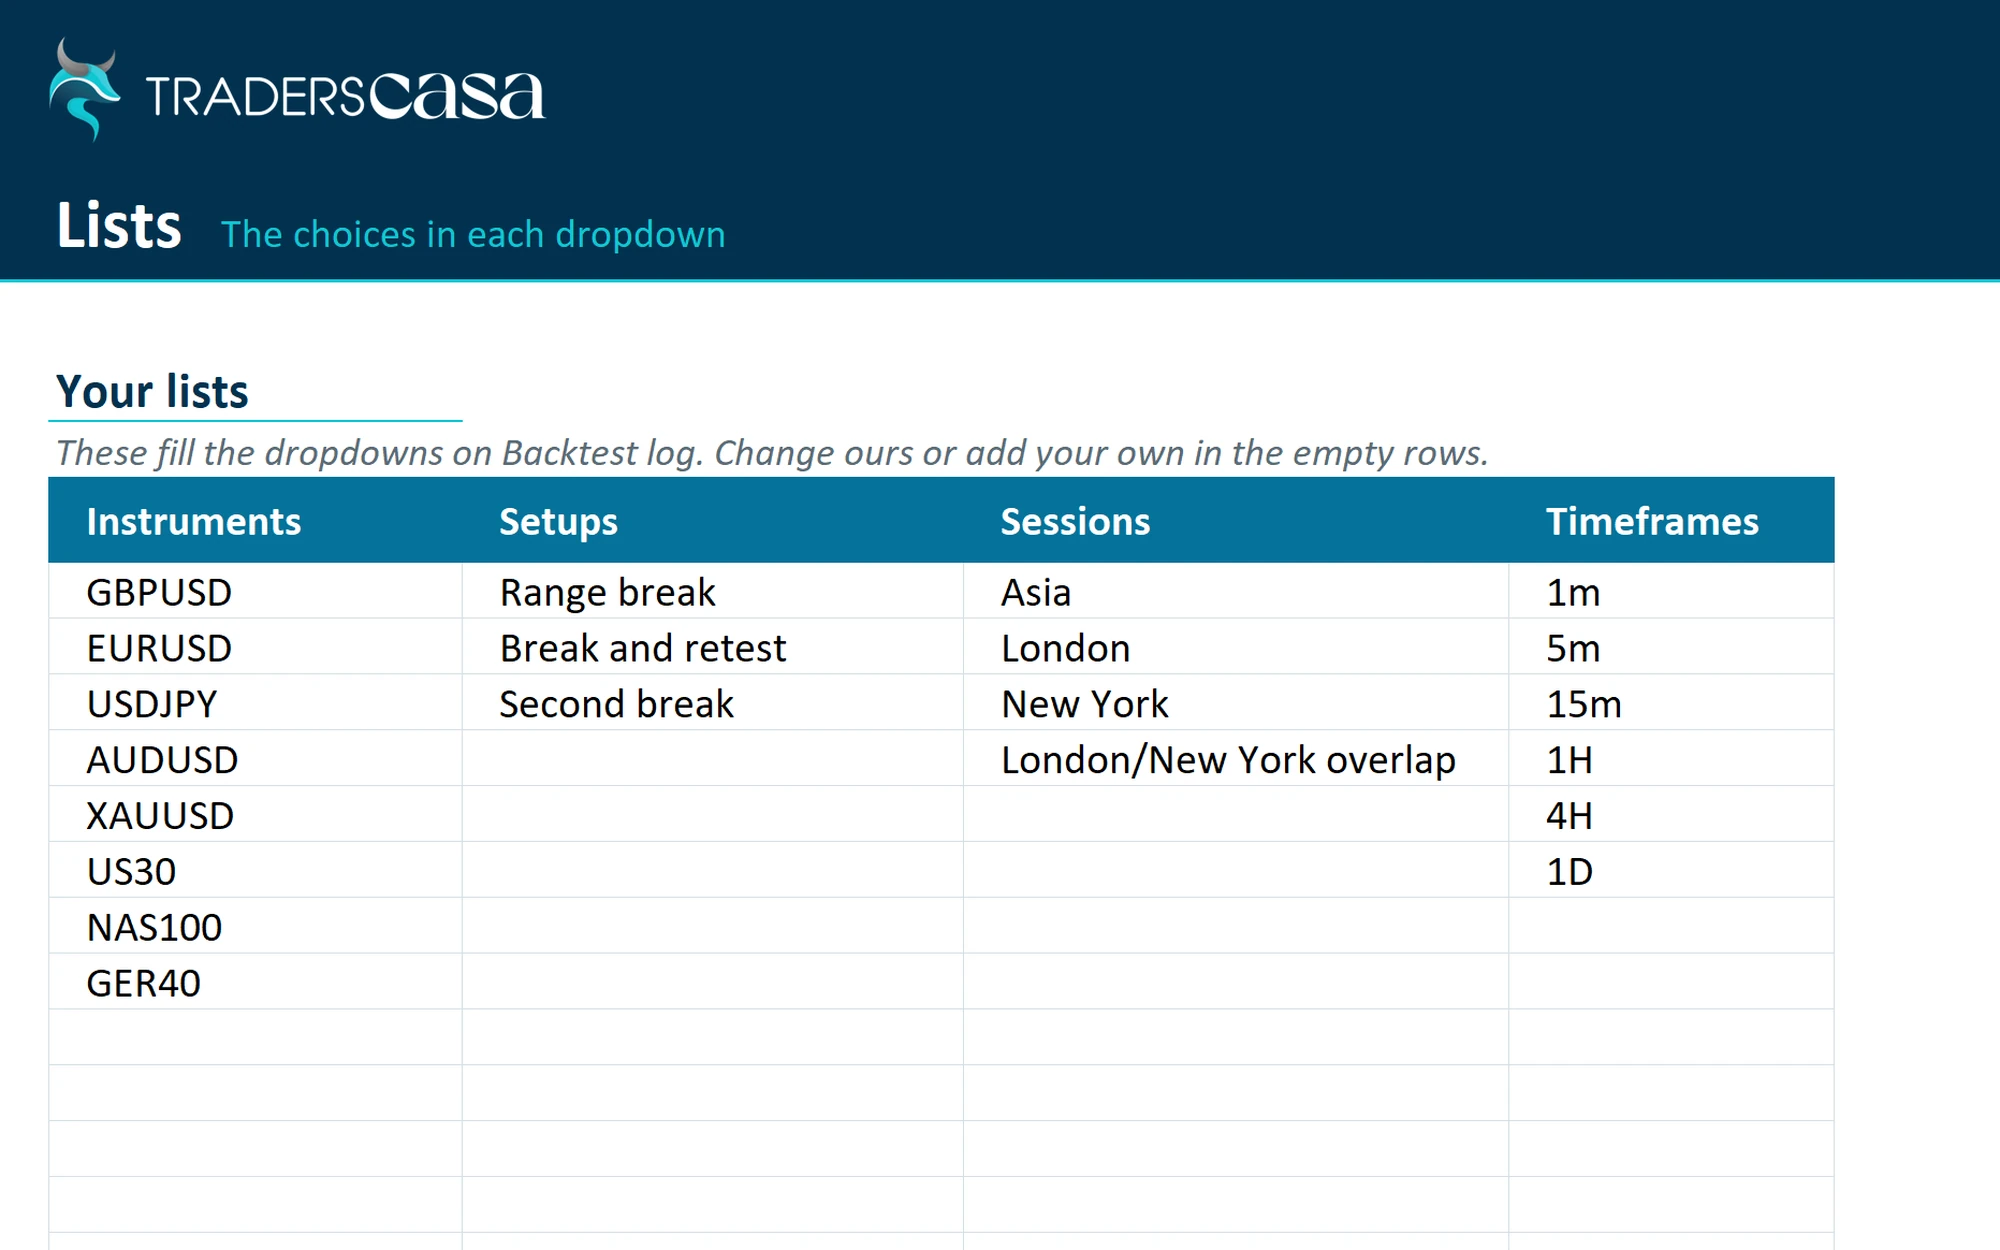
Open a blank sheet. Choose File, Import, Upload, then pick the XLSX. Your dropdowns, formulas and charts come with it.
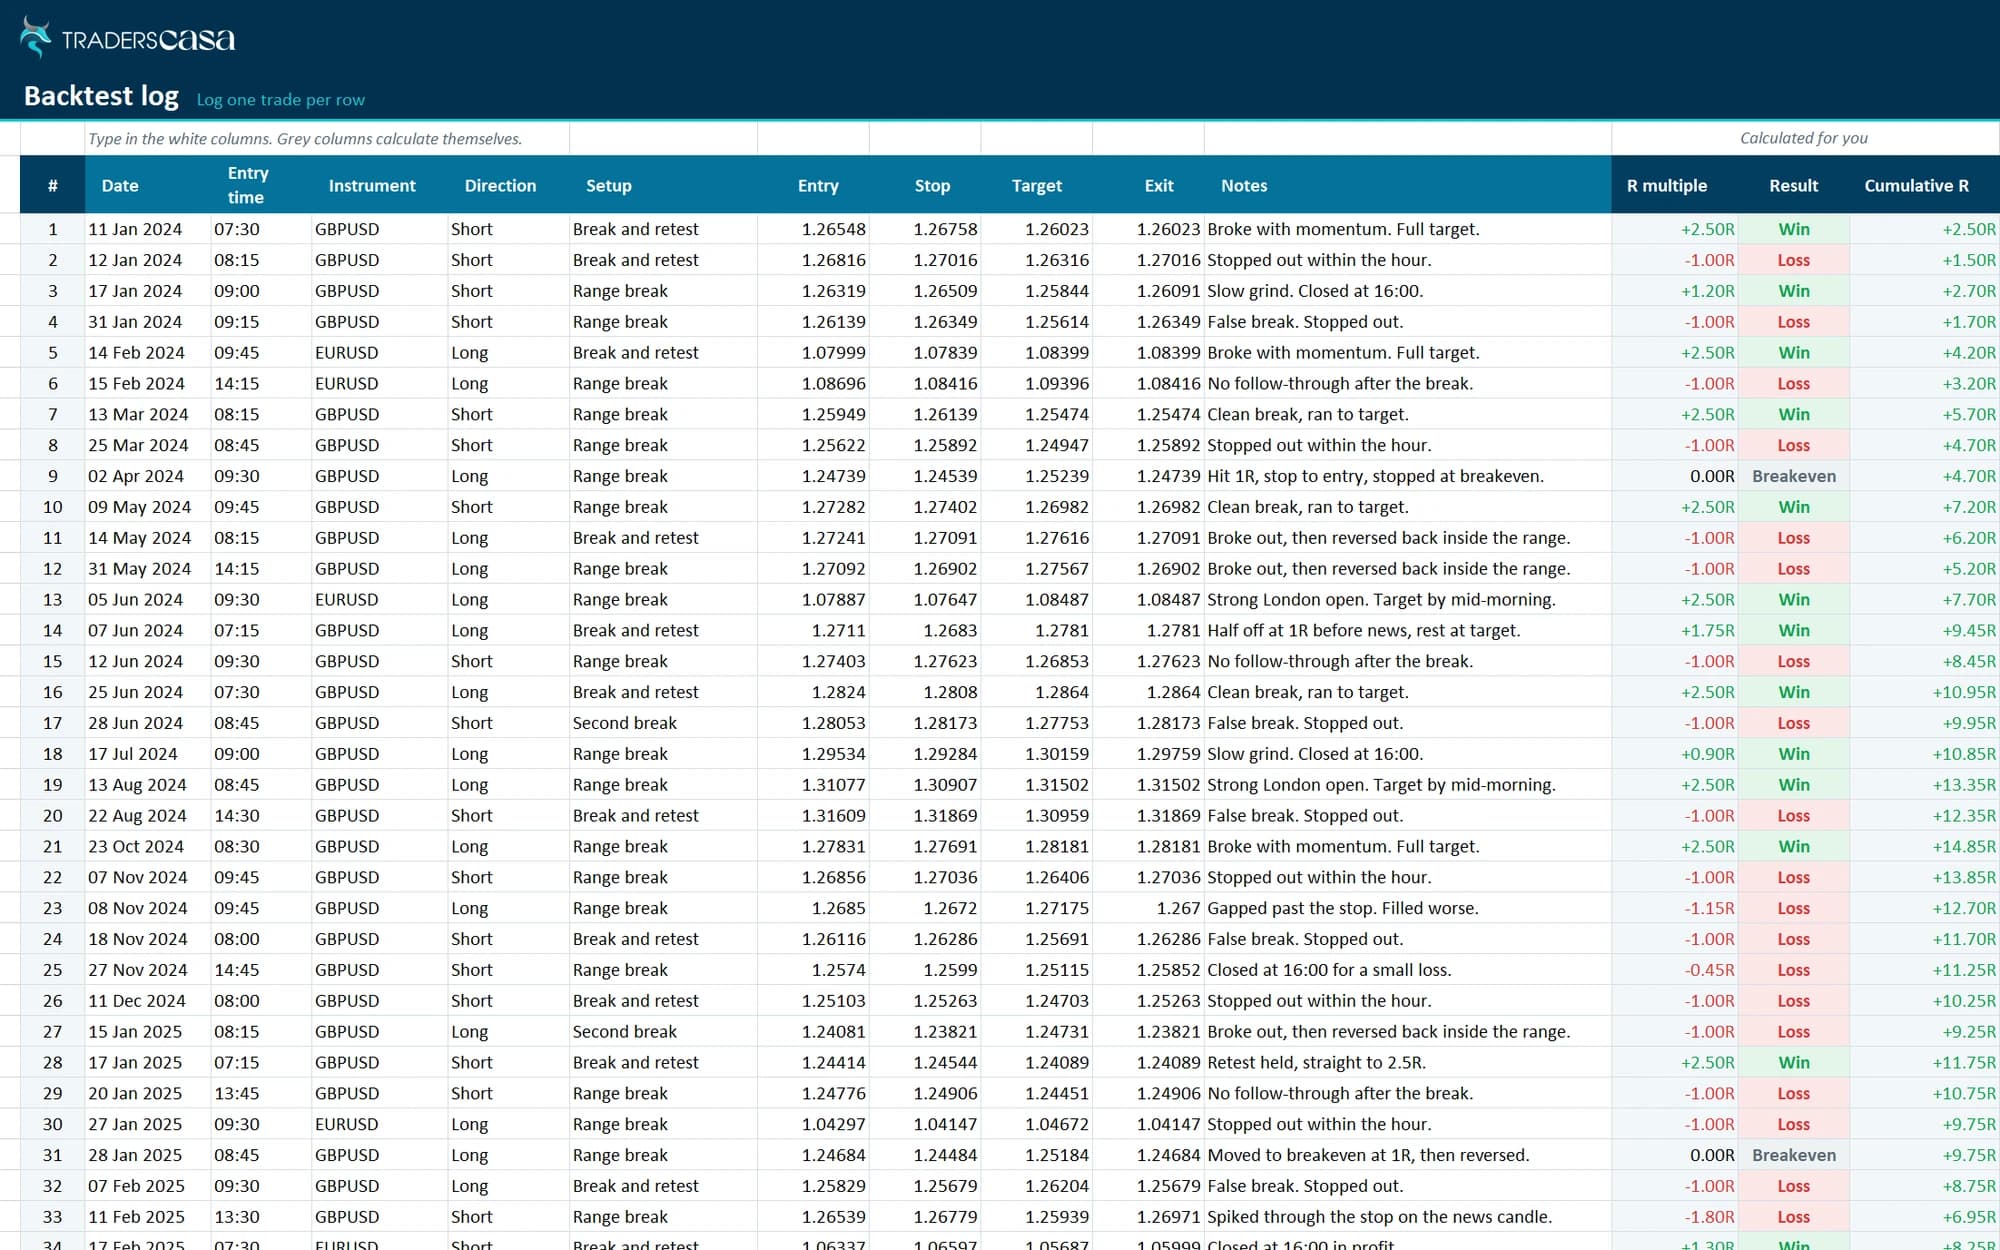
Log trades in R, not money
R puts every trade on the same scale, whatever you risk.
R from your prices
Enter entry, stop and exit. Your R multiple and result calculate automatically.
Override partial closes
Scaled out? Enter the R you actually made to replace the price-based result.
Keep a running total
Cumulative R updates after every trade, while Results tracks your drawdown.
Keep the evidence
Add a screenshot link and notes so you can review the trade later.
Know when the result means something
A good run can be luck. The spreadsheet shows how much evidence you have.
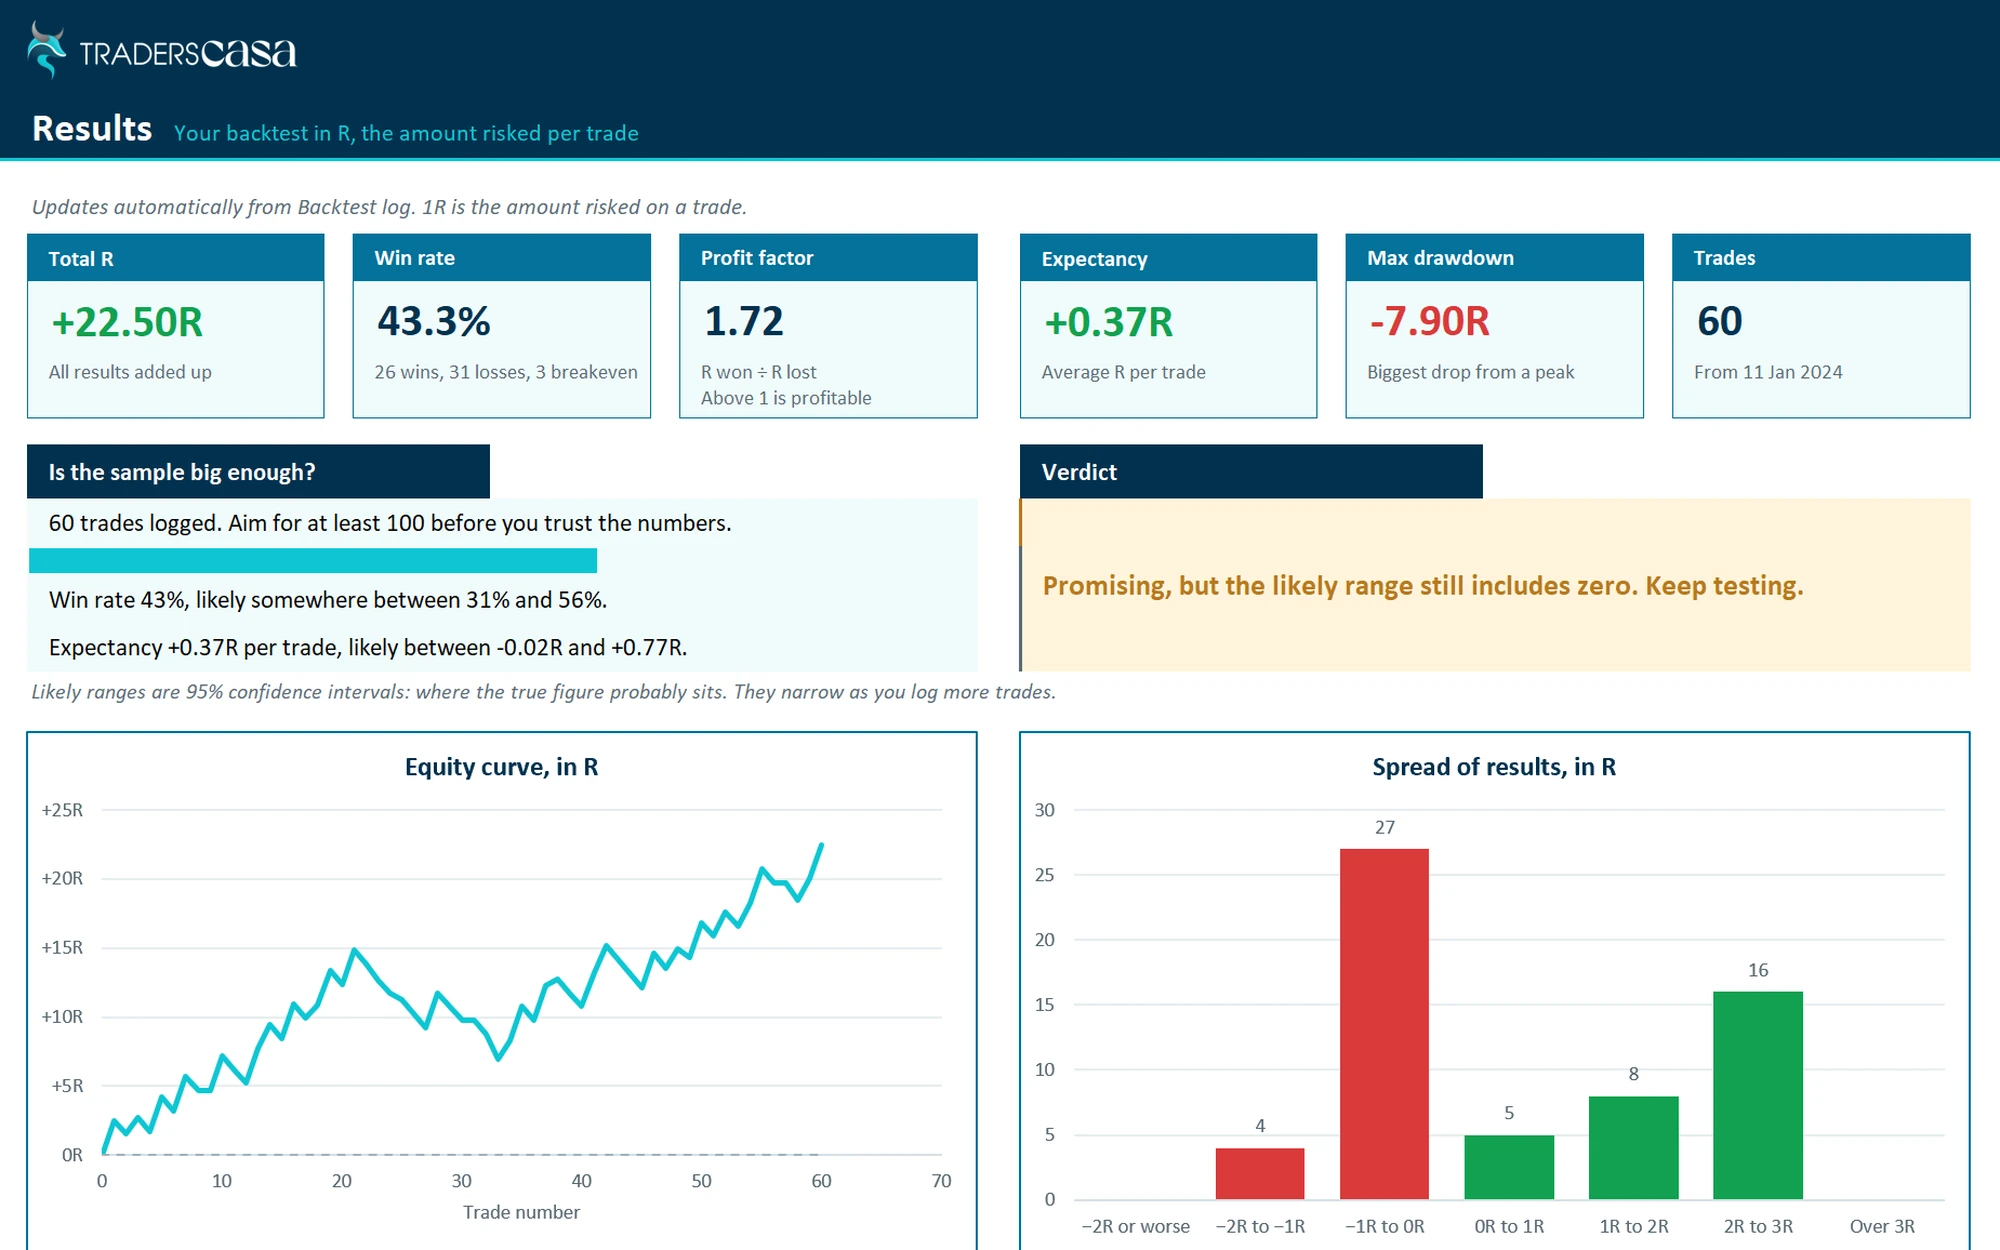
Results gives you total R, win rate, profit factor, expectancy, max drawdown in R and number of trades. You also get SQN, streaks, an equity curve, result spread and breakdowns by setup, direction, session and weekday.
The sample check tracks your progress towards 100 trades and gives 95% confidence ranges for win rate and expectancy. It then tells you in plain English whether the result looks useful or needs more testing.
Why the range matters
A 50% win rate from 30 trades could be about 32% to 68%. From 300 trades, about 44% to 56%. More trades, less guessing.
How to run a clean manual backtest
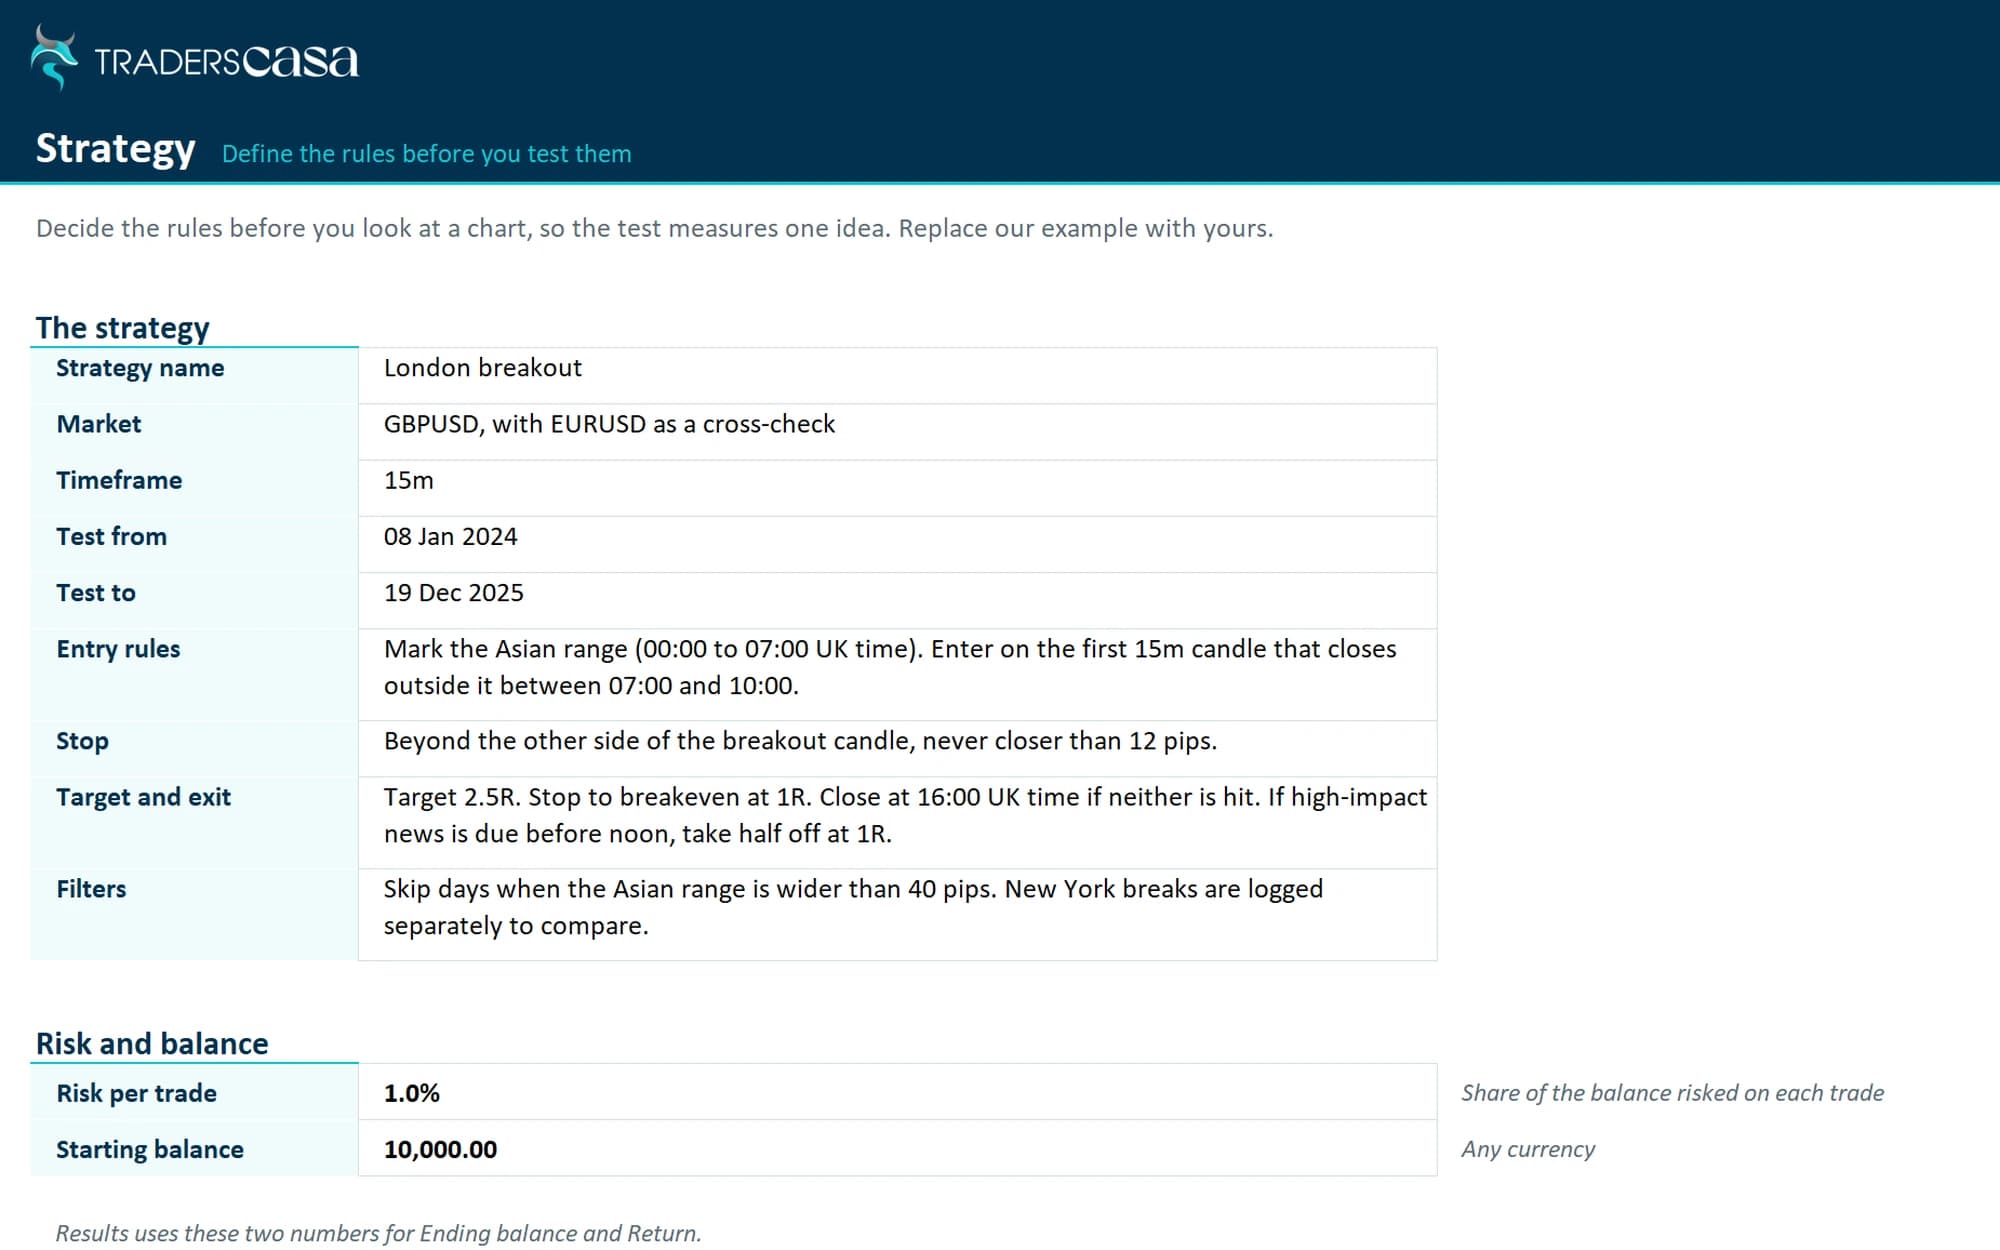
Write the rules first
Complete the Strategy sheet before trade one. Do not change the rules halfway through.
Set the test
Choose your instrument, timeframe and test period before looking for setups.
Log every setup
Record every valid trade, including losers and the obvious mistakes you spot afterwards.
Read the results
Check expectancy and drawdown, then the sample check, before drawing conclusions.
Faster with bar replay
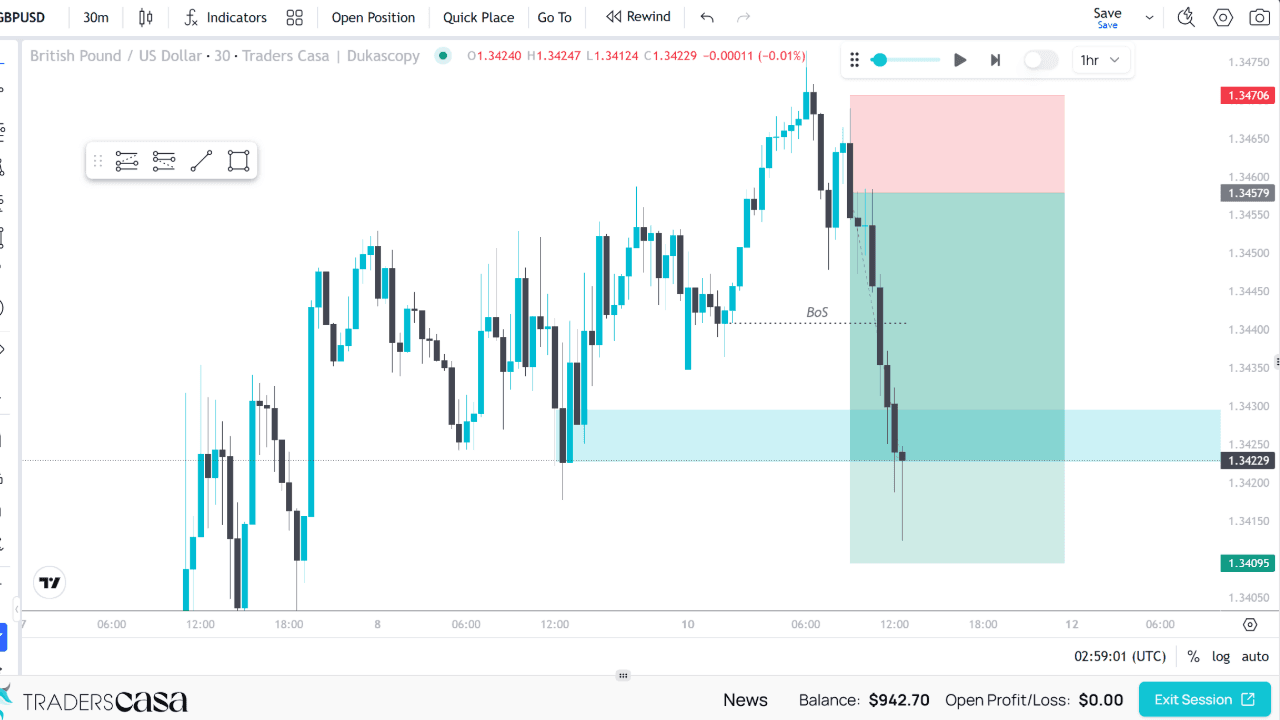
Scrolling backwards shows you what happens next. Bar replay does not.
Traders Casa replays historical charts candle by candle without showing the next candle. It also records every trade for you. Bar replay and unlimited backtest sessions are included on every plan, including Free.
Questions, answered
Is this backtesting spreadsheet free?
Yes. Download the full 332 KB XLSX and 1 KB CSV with no email, account or card. The workbook includes example trades so you can see how it works before clearing them and starting your own backtest.
What does it work out for me?
It calculates total R, win rate, profit factor, expectancy, average win and loss, max drawdown in R, winning and losing streaks, SQN, ending balance and return. You also get an equity curve, result spread and 95% confidence ranges for win rate and expectancy.
How many trades should I backtest?
The spreadsheet tracks your progress towards 100 trades and shows 95% confidence ranges for win rate and expectancy as you go. The more trades you test, the narrower those ranges become and the less your conclusion depends on a short run of results.
Why measure results in R?
R measures each result against the risk taken on that trade. That puts different trades and strategies on the same scale, regardless of account or position size. The spreadsheet can then show ending balance and return using your chosen risk per trade.
Spreadsheet or backtesting software?
A spreadsheet gives you full control over manual testing and the numbers behind it. Traders Casa is faster: bar replay hides the next candle and records every trade automatically. Bar replay and unlimited backtest sessions are included on every plan, including Free.
More free tools
All free tools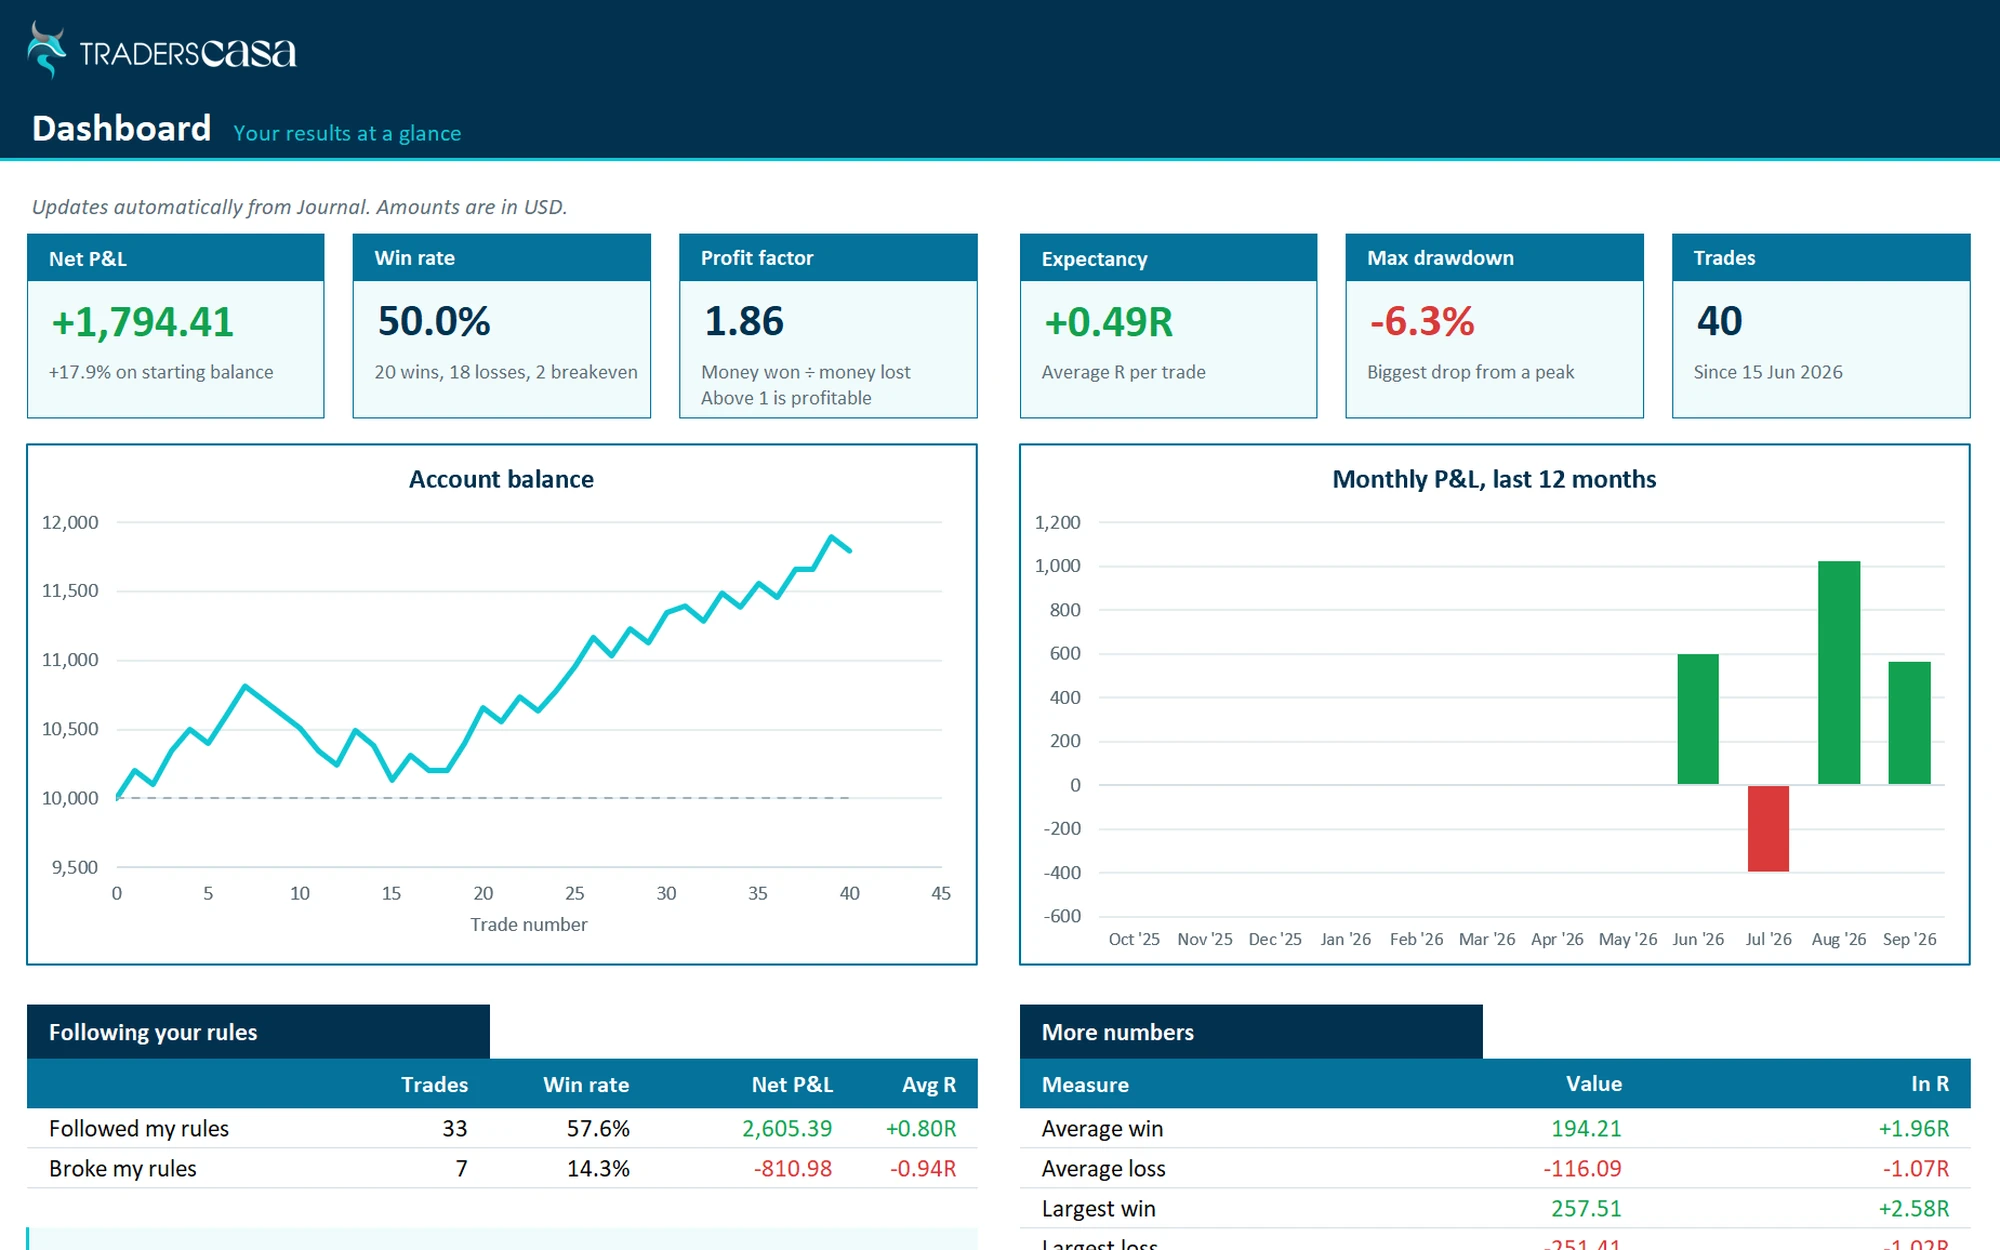

Skip the manual logging
Traders Casa replays the chart and records every trade for you. Unlimited backtest sessions on the free plan, no card needed.